Pandas Handle Missing Data
When working in Python Pandas, you’ll encounter null (missing) data.
As a Data Analyst or Scientist, you’ll need to develop strategies for handling missing data to ensure accurate and effective analysis of the dataset.
In this lesson we will take a look at 24 different ways in which we can handle missing data within Python Pandas. If you want to watch our video based around the tutorial, it’s embedded down below.
Prepping the lesson
To start the tutorial, let’s bring in Pandas and NumPy.
import pandas as pd import numpy as np We want to create a dataframe to use for the majority of the lesson. To do that we are going to utilize different bands, and how many tickets are sold on a nightly basis on tour.
Let’s create a dictionary and then pass it into pd.DataFrame(). np.nan are our null (missing) values in the dataset.
data = { 'The Who': [np.nan, 25000, np.nan, 42000], # Large arena/stadium sales 'All Them Witches': [np.nan, 1500, 2200, 2800], # Theater/club-level sales 'Goose': [3200, 5000, 7200, 8800] # Large theaters and small arenas } df = pd.DataFrame(data) 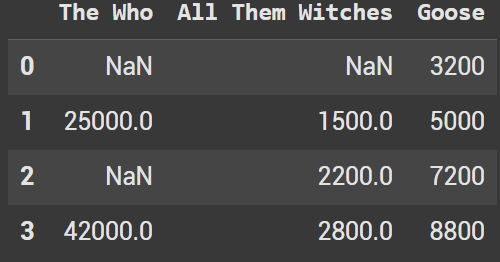
Example 1 - isnull()
Our first example will take a look at isnull(). Let’s look specifically at the Who which should have two null values. If a value is null, it shows up as True. If there is a value, it shows up as False.
As you see with the output we have two rows which are true.
df['The Who'].isnull() 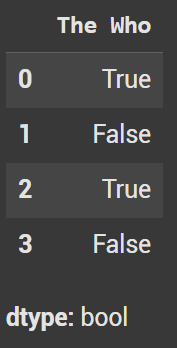
We can also look at the dataframe in general to see the null values across multiple columns.�
df.isnull() 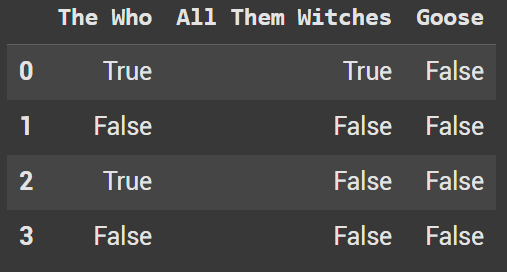
Example 2 - isna()
The isna() function is nearly identical to isnull() and can be used interchangeably. Let’s look at the same examples as above.
df['The Who'].isna() 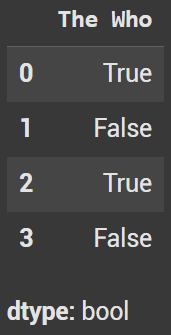
df.isna() 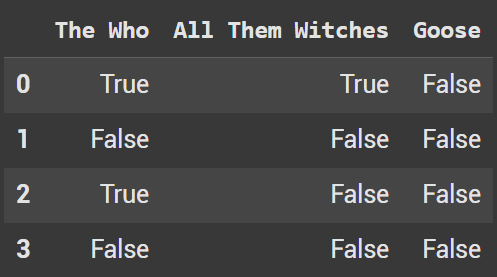
Example 3
The opposite of isnull() or isna() is notna(). If a value is null, it shows up as False. If a value is not null it shows up as true.
df.notna() 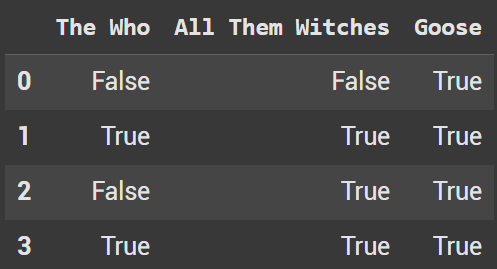
Example 4 - Count of missing values per column
df.isnull().sum() 
You can also specify this for one column. It’s helpful for a large dataset, but in general it’s probably wiser to use it on the full dataframe.
df['The Who'].isnull().sum() np.int64(2)
Example 5 - info() to find Non-Null Count
Info gives a quick synopsis of the different columns in a dataframe and shows the non-null counts. If you notice the non-null counts are different in each column, we know that there are null values in the dataframe.
df.info() 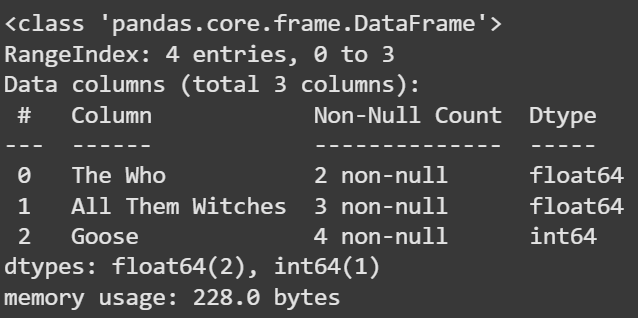
Example 6 - size vs count
A common interview question is to look at size vs value. Size includes null values whereas count doesn’t include null values. Let’s look at what is shown with The Who column.
df['The Who'].size 4
df['The Who'].count() np.int64(2)
Example 7 - filter on null values
We can use this logic now when filtering from our dataframe. In this example I want to see all the rows in which All Them Whiches has a value in the dataframe.
df[df['All Them Witches'].notna()] 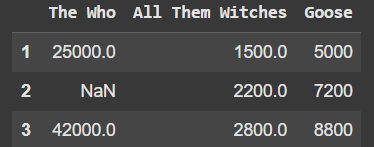
Example 8 - Filter Null Multiple Conditions
Let’s look at filtering on multiple conditions. We will also throw in examples of using .isna().
df[(df['The Who'].isna()) & (df['All Them Witches'].notna())] 
This line of code gives use values where Who is Null or Goose ticket sales are less than 5000
df[(df['The Who'].isna()) | (df['Goose'] < 5000)] 
Example 9 - Sorting With Null Values
na_position = first brings the null values to the top where last brings them to the bottom.
df.sort_values(by='The Who', na_position='first') 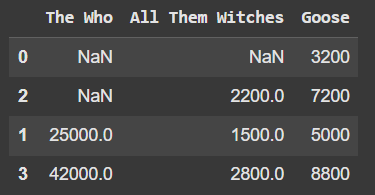
df.sort_values(by='The Who', ascending=False, na_position='last') 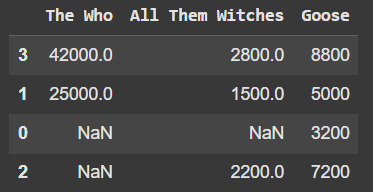
Example 10 - Remove Row Null Value with dropna()
df_remove_row = df.dropna() 
Example 11 - Remove Row where there are 2 null values
df_remove_row_2 = df.dropna(thresh=2) 
Example 12 - Remove Column with null values
df_remove_column = df.dropna(axis=1) 
Example 13 - Fill Null Values with an Integer
df_filled = df.fillna(0) 
Example 14 - Fill Null Values With Strings
This dataframe will be based around bands I’ve seen at the St Augustine Amphitheater and Hard Rock Orlando.
venue_list = {'St Augustine Amp': ['Billy Strings', np.nan, 'The Smile', 'Gojira', 'Mastodon'], 'Hard Rock Orlando': ['City and Colour', 'Toto', 'Mastodon', np.nan, 'Dream Theater']} venue_df = pd.DataFrame(venue_list) 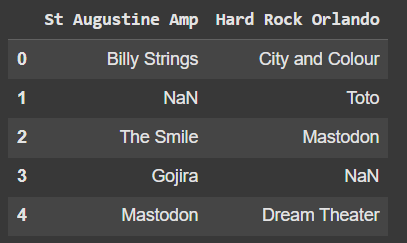
Since we do not know what band played at the venue, let’s call the null values Unknown Band.
df_filled2 = venue_df.fillna('Unknown Band') 
Example 15 - Forward Fill
Forward Fill will populate the null value with the previous row in the dataframe.
df_ffill = df.ffill() 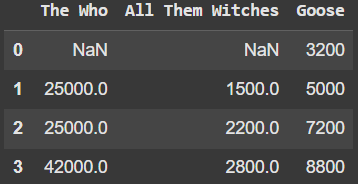
Example 16 - Backwards Fill
Backwards Fill will populate the null value with next row in the dataframe.
df_bfill = df.bfill() 
Example 17 - GroupBy With Forward Fill
You can also utilize a Groupby with either a forward or backward fill. In this example we will use forward fill.
df_baseball = pd.DataFrame({ 'team': ['Yankees', 'Yankees', 'Dodgers', 'Dodgers', 'Dodgers'], 'batting_avg': [0.310, np.nan, 0.280, np.nan, 0.290] }) df_baseball['batting_avg'] = df_baseball.groupby('team')['batting_avg'].ffill() 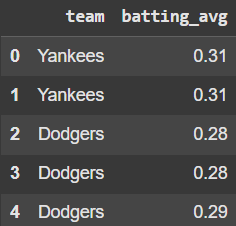
Example 18 - Fill With Statistics
One of the most common approaches to filling null values is to utilize statistics. Let’s look at using the mean for The Who and the median for All Them Witches.
df_fill_na = df.copy() df_fill_na['The Who'].mean() np.float64(33500.0)
df_fill_na['The Who'] = df_fill_na['The Who'].fillna(df_fill_na['The Who'].mean()) df_fill_na['All Them Witches'] = df_fill_na['All Them Witches'].fillna(df_fill_na['All Them Witches'].median()) 
Example 19 - Interpolation
Interpolation estimates the missing values on other existing data.
df_interpolated = df.interpolate(method='linear', axis=0) 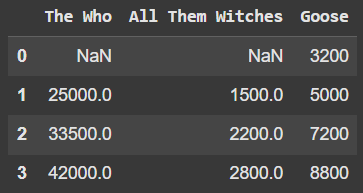
Example 20 - Interpolation with backwards fill
df_interpolated_2 = df.interpolate(method='linear', axis=0).bfill() 
Example 21 - Replace Function
The replace function allows you to replace one value with another. We can use np.nan as the value you want replaced.
df_replaced_1 = df.replace(np.nan, 0) 
You can also pass in a dictionary to replace multiple values at once.
df_replaced_2 = df.replace({np.nan: 0, 5000: 5500}) 
Example 22 - Mask
Mask works similiar to replace, except we can use logic. Instead of np.nan we use .isnull()
df_masked_1 = df.mask(df.isnull(), 0) 
Let’s also look at what happens if we have a value less than 0. Technically you can’t sell negative tickets so let’s mask them with a null value.
df_masked_2 = df.mask(df < 0, np.nan) Example 23 - Where
Where is the opposite of mask. So when looking at replacing null values we use df.notnull()
df_where_1 = df.where(df.notnull(), 0) 
And this time we will use df>0 to replace any negative values with null.
df_where_2 = df.where(df > 0, np.nan) Example 24 - Custom Logic With Fillna
df_logic['The Who'] = df_logic['The Who'].fillna(df_logic['The Who'].median() if df_logic['The Who'].median() > 500 else 0) 
Ryan is a Data Scientist at a fintech company, where he focuses on fraud prevention in underwriting and risk. Before that, he worked as a Data Analyst at a tax software company. He holds a degree in Electrical Engineering from UCF.
