If you want to watch a YouTube video that is based around this Pandas Expanding tutorial, it is embedded below.
Tutorial Prep
Before we start looking at expanding, we need to import both Pandas and Numpy. Pandas has expanding and Numpy will be utilized when we look at Null values a bit later in the lesson.
					import pandas as pd
import numpy as np
The data we will be using in this tutorial will be based around Billy Strings concerts, a musician I frequently listen to. As an artist he will play in the same city over multiple nights allowing which is a great example for us to dive into groupby a bit later in the tutorial.
Our initial dataframe will have a concert date, the venue, city, state, and the venue capacity. We will build on this a bit later. Let’s start with a list.
					data = [
    ["2025-02-21", "State Farm Arena", "Atlanta", "GA", 21000],
    ["2025-02-22", "State Farm Arena", "Atlanta", "GA", 21000],
    ["2025-02-28", "Bridgestone Arena", "Nashville", "TN", 19891],
    ["2025-03-01", "Bridgestone Arena", "Nashville", "TN", 19891],
    ["2025-04-03", "St. Augustine Amphitheatre", "St. Augustine", "FL", 4700],
    ["2025-04-04", "St. Augustine Amphitheatre", "St. Augustine", "FL", 4700],
    ["2025-04-05", "St. Augustine Amphitheatre", "St. Augustine", "FL", 4700],
    ["2025-04-09", "Yuengling Center", "Tampa", "FL", 10411],
    ["2025-04-11", "Enmarket Arena", "Savannah", "GA", 9500],
    ["2025-04-12", "Enmarket Arena", "Savannah", "GA", 9500],
    ["2025-04-15", "John Paul Jones Arena", "Charlottesville", "VA", 14593],
    ["2025-04-17", "Koka Booth Amphitheatre", "Cary", "NC", 7000],
    ["2025-04-18", "Koka Booth Amphitheatre", "Cary", "NC", 7000],
    ["2025-04-19", "Koka Booth Amphitheatre", "Cary", "NC", 7000],
    ["2025-05-13", "Talking Stick Resort Amphitheatre", "Phoenix", "AZ", 20000],
    ["2025-05-15", "North Island Credit Union Amphitheatre", "Chula Vista", "CA", 20500],
    ["2025-05-16", "Hollywood Bowl", "Los Angeles", "CA", 17500],
    ["2025-05-18", "Toyota Amphitheatre", "Wheatland", "CA", 18500],
    ["2025-05-20", "Ford Idaho Center Amphitheater", "Nampa", "ID", 10500],
    ["2025-05-22", "ONE Spokane Stadium", "Spokane", "WA", 12000],
    ["2025-05-24", "RV Inn Style Resorts Amphitheater", "Ridgefield", "WA", 18000],
    ["2025-05-25", "Gorge Amphitheatre", "George", "WA", 27500],
    ["2025-05-30", "Van Andel Arena", "Grand Rapids", "MI", 10834],
    ["2025-05-31", "Van Andel Arena", "Grand Rapids", "MI", 10834],
    ["2025-06-06", "Allstate Arena", "Rosemont", "IL", 18500],
    ["2025-06-07", "Allstate Arena", "Rosemont", "IL", 18500],
    ["2025-06-11", "T-Mobile Center", "Kansas City", "MO", 18972],
    ["2025-06-13", "Chaifetz Arena", "St. Louis", "MO", 10600],
    ["2025-06-14", "Chaifetz Arena", "St. Louis", "MO", 10600],
    ["2025-06-20", "Rupp Arena", "Lexington", "KY", 23500],
    ["2025-06-21", "Rupp Arena", "Lexington", "KY", 23500],
    ["2025-07-04", "Germania Insurance Amphitheater", "Austin", "TX", 14000],
    ["2025-07-06", "Dos Equis Pavilion", "Dallas", "TX", 20000],
    ["2025-07-09", "Walmart AMP", "Rogers", "AR", 9500],
    ["2025-07-11", "Ascend Amphitheater", "Nashville", "TN", 6800],
    ["2025-07-12", "Ascend Amphitheater", "Nashville", "TN", 6800],
    ["2025-07-14", "PNC Music Pavilion", "Charlotte", "NC", 19500],
    ["2025-07-16", "Coastal Credit Union Music Park", "Raleigh", "NC", 20000],
    ["2025-07-18", "Veterans United Home Loans Amphitheater", "Virginia Beach", "VA", 20000],
    ["2025-07-20", "Merriweather Post Pavilion", "Columbia", "MD", 19319],
    ["2025-07-23", "Saratoga Performing Arts Center", "Saratoga Springs", "NY", 25100],
    ["2025-07-25", "Bethel Woods Center for the Arts", "Bethel", "NY", 15000],
    ["2025-07-27", "Xfinity Theatre", "Hartford", "CT", 30000],
    ["2025-07-30", "Bank of New Hampshire Pavilion", "Gilford", "NH", 9000],
    ["2025-08-01", "Maine Savings Amphitheater", "Bangor", "ME", 15000],
    ["2025-08-03", "Leader Bank Pavilion", "Boston", "MA", 5000],
    ["2025-08-05", "Northwell Health at Jones Beach Theater", "Wantagh", "NY", 15000],
    ["2025-08-07", "PNC Bank Arts Center", "Holmdel", "NJ", 17500]
]
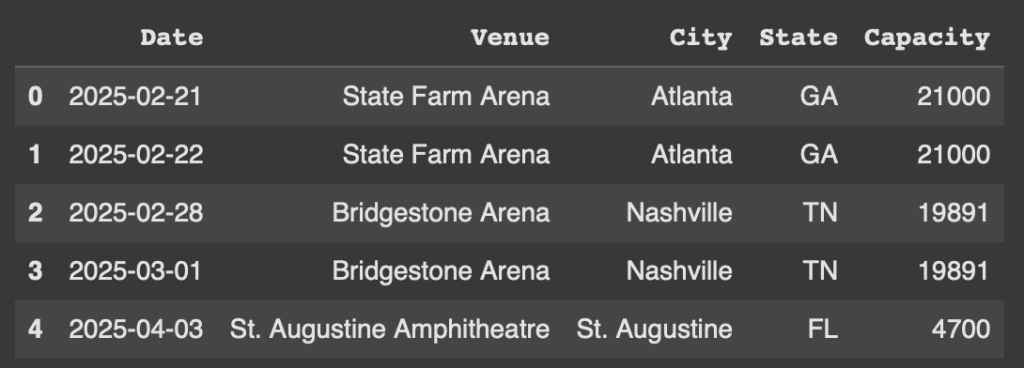
We are going to pass in the list to a dataframe and define the different column names based on the information mentioned above.
					df = pd.DataFrame(data, columns=["Date", "Venue", "City", "State", "Capacity"])
df.head()
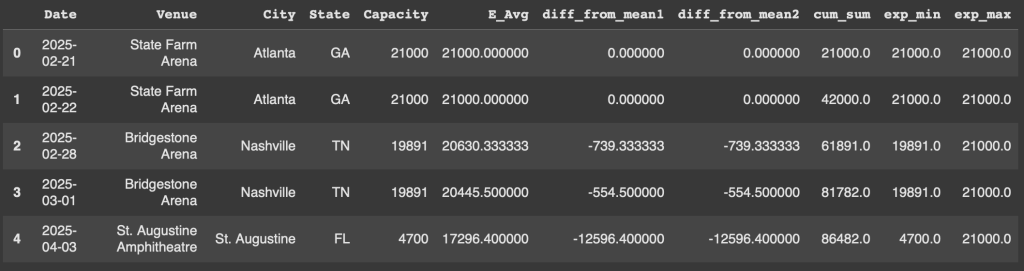
The head below will showcase the first 5 results of the dataframe.
Example 1 - Expanding Mean
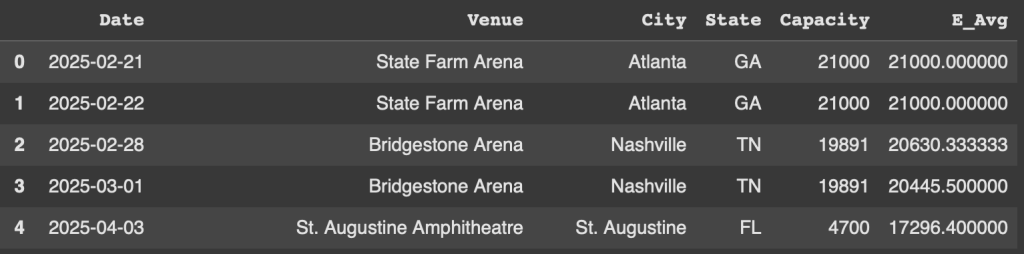
With our first example, let’s look at the usecase of an expanding mean. Essentially what this does is change our mean depending on the next row’s value in the dataframe. All we have to do is use .expanding() and then attatch .mean()
df['E_Avg'] = df['Capacity'].expanding().mean()
As you can see, since the capacity is 21,000 at the first two concerts, the mean doesn’t change. Once we jump the Nashville concerts, the mean lower slightly. St Augustine, which has a way smaller capacity moves the mean lower.
Example 2 - Finding the difference from the mean
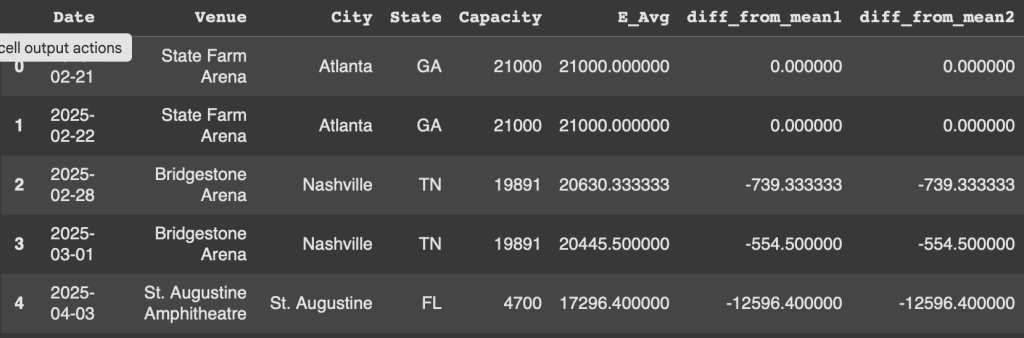
One benefit of using expanding is we can see what datapoints will have the largest difference from the mean in either direction, There are two ways in which we can write this out.
Our first example looks at taking the capacity of the venue and subtracting out the calculation we performed above, column E_avg.
df['diff_from_mean1'] = df['Capacity'] - df['E_Avg']
Our second example essentially created E_avg instead of grabbing the column.
df['diff_from_mean2'] = df['Capacity'] - df['Capacity'].expanding().mean()
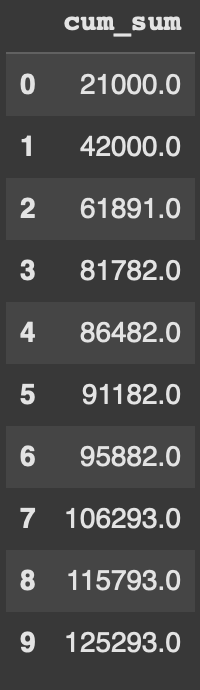
Example 3 - Cumulative sum
Another quite common usecase of expanding is finding the cumulative sum, also known as the cumsum. While this can be found without using expanding, I find expanding gives us way more flexibility in calculations.
df['cum_sum'] = df['Capacity'].expanding().sum()
Example 4 - Min max
This will be our last example of a summary statistic on a single column. As shown with the examples above, we can quickly swap in and out a statistic we want to see. Min/Max are interesting to use with expanding as we can see how the values change as more rows are parsed.
					df['exp_min'] = df['Capacity'].expanding().min()
df['exp_max'] = df['Capacity'].expanding().max()
In index 0 and 1, both min and max are the same. As the concerts move to Nashville, the Min lowers to 19,891. The min lowers again when St Augustine is played.
Example 5 - Different columns
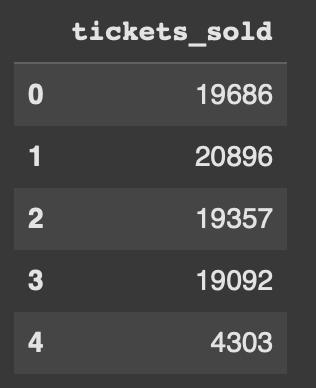
Let’s look at finding the expanding mean across multiple columns as the same time. To do that we first need to create a new column which is tickets sold.
We will randomly generate how many tickets are sold for each concert with the code below. Don’t worry about the syntax as it’s not needed to learn how expanding works.
df['tickets_sold'] = (df['Capacity'] * np.random.uniform(0.9, 1.0, len(df))).astype(int)
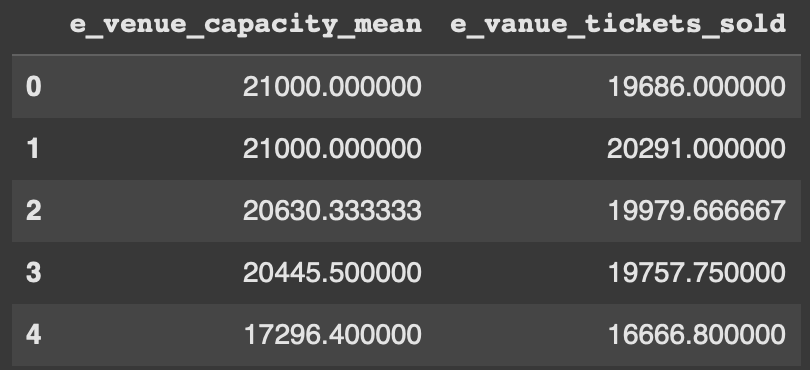
Now this will be the code we want to explore. To create two columns, we will have two have two brackets on the outside. Like our first example we then add on .expanding() and .mean().
df[['e_venue_capacity_mean', 'e_vanue_tickets_sold']] = df[['Capacity', 'tickets_sold']].expanding().mean()
Example 6 - Agg example
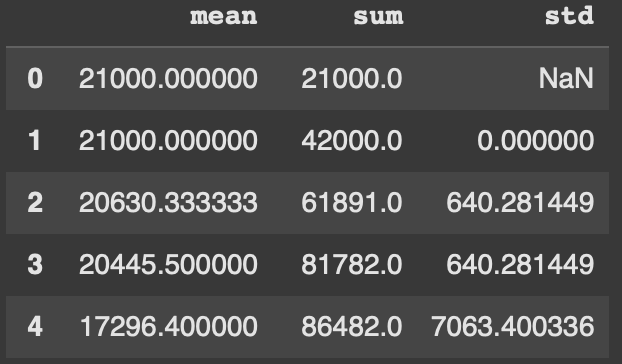
While all the earlier examples showcased one summary statistic at a time, we can also find multiple in one line of code. To do that we use .agg() and pass in a list of statistics we want to find. In this example we look at mean, sum, and standard deviation.
expanding_stats = df['Capacity'].expanding().agg(['mean', 'sum', 'std'])
Example 7 - GroupBy example
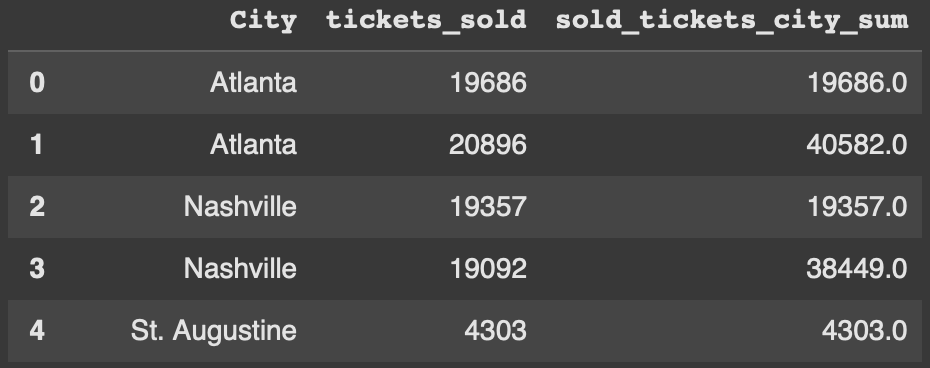
GroupBy is another interesting usecase for expanding. We can groupby each city a concert was performed at and sum up the number of tickets sold. This will allow us to see how our final number for each city is reached.
df['sold_tickets_city_sum'] = df.groupby('City')['tickets_sold'].expanding().sum().reset_index(level=0, drop=True)
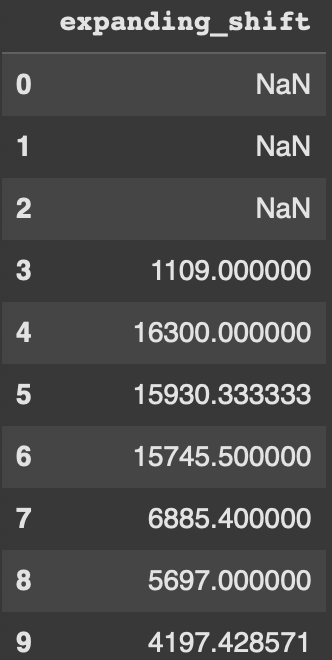
Example 8 - Expanding with shift
Shift allows us to access data in rows above or below based on the number passed in. There are countess opportunities to explore with this, but lets look at how a shift of 3 interacts with the data.
One warning though, depending on how you setup your shift, you may encounter null data in the new column created.
df['expanding_shift'] = df['Capacity'].expanding().mean().shift(3) - df['Capacity']
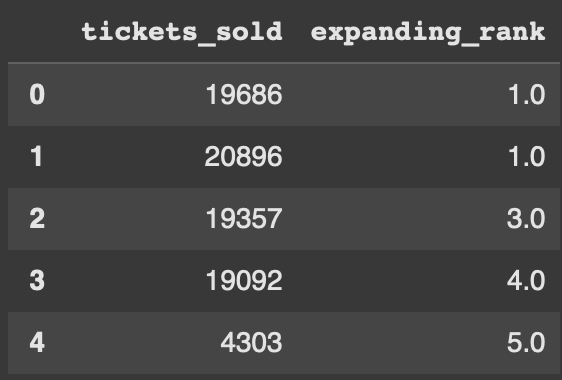
Example 9 - Ranking values by using apply
Another usecase which is kind of interesting is utilizing rank. We will build this out by using .apply() and a lambda function. Essentially what this code allows us to do is rank each row as the data comes in. Let’s look at each concert and how many tickets are sold. We want the most tickets to have a rank of #1 with the least amount of tickets being the lowest rank.
df['expanding_rank'] = df['tickets_sold'].expanding().apply(lambda x: pd.Series(x).rank(ascending = False).iloc[-1])
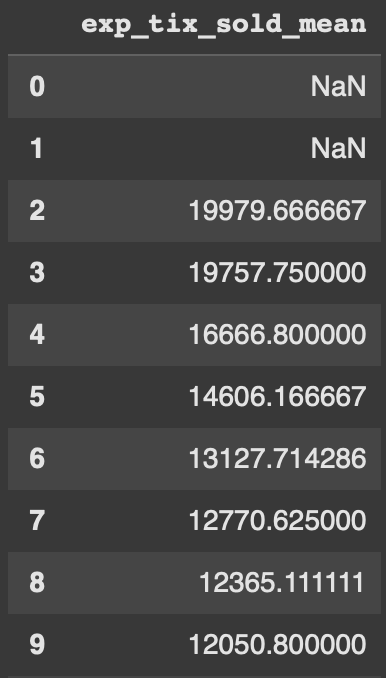
Example 10 - Min periods
Min periods will start the expanding calculation after a certain amount of time. When we use 3, it takes 3 rows of data to start showing values. Like the shift example above, there is a warning of Null values now being in the dataframe.
df['exp_tix_sold_mean'] = df['tickets_sold'].expanding(min_periods=3).mean()