In Python Pandas a rolling function allows you to find statistics over a period. This is done through setting a window size. Let’s look at 12 different examples.
If you want to watch our YouTube video based around the tutorial, it is embedded down below.
Tutorial Prep
Before we jump into this rolling tutorial, let’s import in a few libraries and create a dataframe.
Start by importing in Pandas and NumPy
					import pandas as pd
import numpy as np
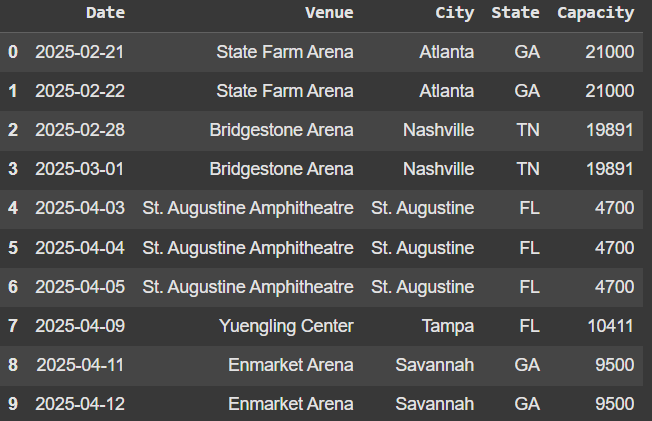
Next we are going to build a Pandas dataframe. The data we are looking at is different concerts by Billy Strings.
					data = [
    ["2025-02-21", "State Farm Arena", "Atlanta", "GA", 21000],
    ["2025-02-22", "State Farm Arena", "Atlanta", "GA", 21000],
    ["2025-02-28", "Bridgestone Arena", "Nashville", "TN", 19891],
    ["2025-03-01", "Bridgestone Arena", "Nashville", "TN", 19891],
    ["2025-04-03", "St. Augustine Amphitheatre", "St. Augustine", "FL", 4700],
    ["2025-04-04", "St. Augustine Amphitheatre", "St. Augustine", "FL", 4700],
    ["2025-04-05", "St. Augustine Amphitheatre", "St. Augustine", "FL", 4700],
    ["2025-04-09", "Yuengling Center", "Tampa", "FL", 10411],
    ["2025-04-11", "Enmarket Arena", "Savannah", "GA", 9500],
    ["2025-04-12", "Enmarket Arena", "Savannah", "GA", 9500],
    ["2025-04-15", "John Paul Jones Arena", "Charlottesville", "VA", 14593],
    ["2025-04-17", "Koka Booth Amphitheatre", "Cary", "NC", 7000],
    ["2025-04-18", "Koka Booth Amphitheatre", "Cary", "NC", 7000],
    ["2025-04-19", "Koka Booth Amphitheatre", "Cary", "NC", 7000],
    ["2025-05-13", "Talking Stick Resort Amphitheatre", "Phoenix", "AZ", 20000],
    ["2025-05-15", "North Island Credit Union Amphitheatre", "Chula Vista", "CA", 20500],
    ["2025-05-16", "Hollywood Bowl", "Los Angeles", "CA", 17500],
    ["2025-05-18", "Toyota Amphitheatre", "Wheatland", "CA", 18500],
    ["2025-05-20", "Ford Idaho Center Amphitheater", "Nampa", "ID", 10500],
    ["2025-05-22", "ONE Spokane Stadium", "Spokane", "WA", 12000],
    ["2025-05-24", "RV Inn Style Resorts Amphitheater", "Ridgefield", "WA", 18000],
    ["2025-05-25", "Gorge Amphitheatre", "George", "WA", 27500],
    ["2025-05-30", "Van Andel Arena", "Grand Rapids", "MI", 10834],
    ["2025-05-31", "Van Andel Arena", "Grand Rapids", "MI", 10834],
    ["2025-06-06", "Allstate Arena", "Rosemont", "IL", 18500],
    ["2025-06-07", "Allstate Arena", "Rosemont", "IL", 18500],
    ["2025-06-11", "T-Mobile Center", "Kansas City", "MO", 18972],
    ["2025-06-13", "Chaifetz Arena", "St. Louis", "MO", 10600],
    ["2025-06-14", "Chaifetz Arena", "St. Louis", "MO", 10600],
    ["2025-06-20", "Rupp Arena", "Lexington", "KY", 23500],
    ["2025-06-21", "Rupp Arena", "Lexington", "KY", 23500],
    ["2025-07-04", "Germania Insurance Amphitheater", "Austin", "TX", 14000],
    ["2025-07-06", "Dos Equis Pavilion", "Dallas", "TX", 20000],
    ["2025-07-09", "Walmart AMP", "Rogers", "AR", 9500],
    ["2025-07-11", "Ascend Amphitheater", "Nashville", "TN", 6800],
    ["2025-07-12", "Ascend Amphitheater", "Nashville", "TN", 6800],
    ["2025-07-14", "PNC Music Pavilion", "Charlotte", "NC", 19500],
    ["2025-07-16", "Coastal Credit Union Music Park", "Raleigh", "NC", 20000],
    ["2025-07-18", "Veterans United Home Loans Amphitheater", "Virginia Beach", "VA", 20000],
    ["2025-07-20", "Merriweather Post Pavilion", "Columbia", "MD", 19319],
    ["2025-07-23", "Saratoga Performing Arts Center", "Saratoga Springs", "NY", 25100],
    ["2025-07-25", "Bethel Woods Center for the Arts", "Bethel", "NY", 15000],
    ["2025-07-27", "Xfinity Theatre", "Hartford", "CT", 30000],
    ["2025-07-30", "Bank of New Hampshire Pavilion", "Gilford", "NH", 9000],
    ["2025-08-01", "Maine Savings Amphitheater", "Bangor", "ME", 15000],
    ["2025-08-03", "Leader Bank Pavilion", "Boston", "MA", 5000],
    ["2025-08-05", "Northwell Health at Jones Beach Theater", "Wantagh", "NY", 15000],
    ["2025-08-07", "PNC Bank Arts Center", "Holmdel", "NJ", 17500]
]
df = pd.DataFrame(data, columns=["Date", "Venue", "City", "State", "Capacity"])
df.head(10)
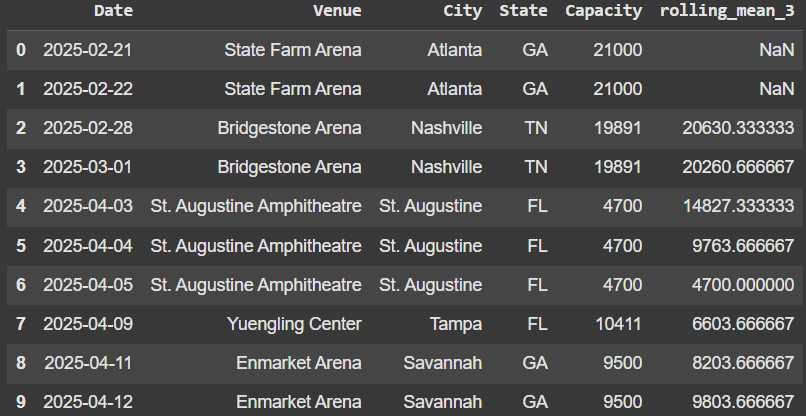
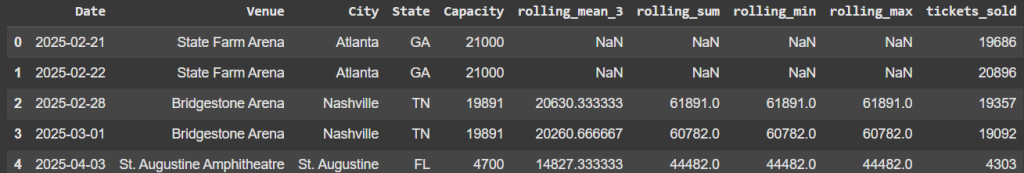
Example 1 - Rolling Average
To take a look at the average over the last 3, we set window = 3.
df['rolling_mean_3'] = df['Capacity'].rolling(window=3).mean()
df.head(10)
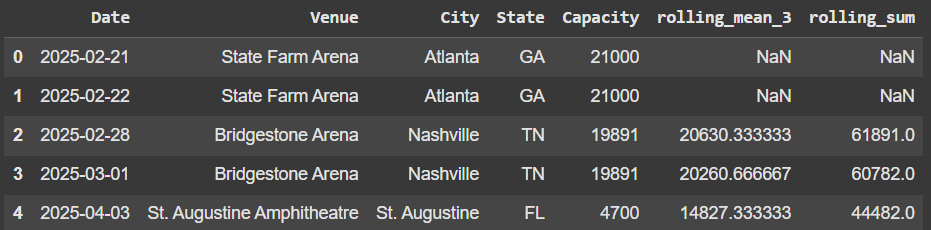
Example 2 - Rolling Sum
df['rolling_sum'] = df['Capacity'].rolling(window=3).sum()
df.head()
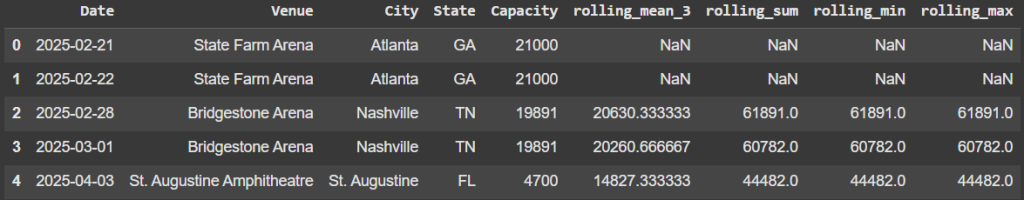
Example 3 - Rolling Min/Max
					df['rolling_min'] = df['Capacity'].rolling(window=3).sum()
df['rolling_max'] = df['Capacity'].rolling(window=3).sum()
df.head()
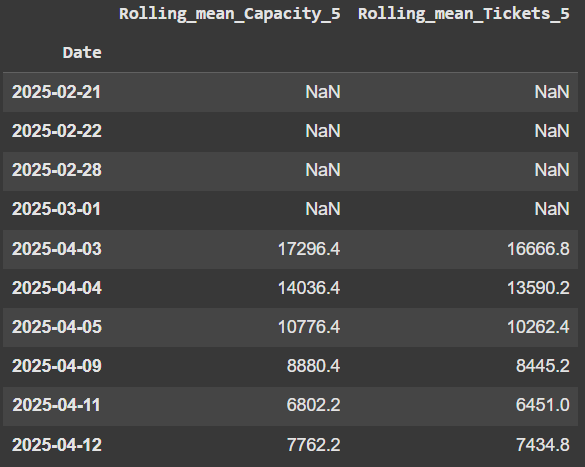
Example 4 - Rolling Window Different Columns
Let’s look at using a rolling window function with multiple columns at the same time.
Before we do that, let’s generate another column. This time it’s for tickets sold for each of the venues.
np.random.seed(42)
df['tickets_sold'] = (df['Capacity'] * np.random.uniform(0.9, 1.0, len(df))).astype(int)
df.head()
df[['Rolling_mean_Capacity_5', 'Rolling_mean_Tickets_5']] = df[['Capacity', 'tickets_sold']].rolling(window=5).mean()
df[['Rolling_mean_Capacity_5', 'Rolling_mean_Tickets_5']].head()
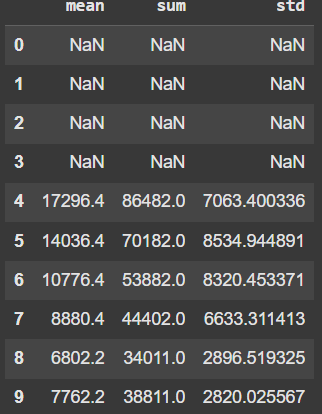
Example 5 - Rolling Agg
We can also perform multiple calculations on the same column at one time. Let’s set a window to 5 and use mean, sum, and std.
rolling_stats = df['Capacity'].rolling(window=5).agg(['mean', 'sum', 'std'])
rolling_stats.head(10)
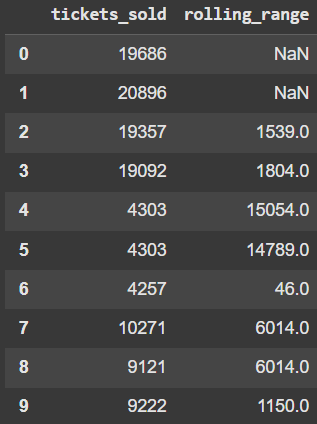
Example 6 - Apply
Apply is quite common to use within Pandas. We can also use it with rolling. Let’s look at using a lambda function inside and take the max – min.
df['rolling_range'] = df['tickets_sold'].rolling(window=3).apply(lambda x: x.max() - x.min())
df[['tickets_sold', 'rolling_range']].head(10)
Example 7
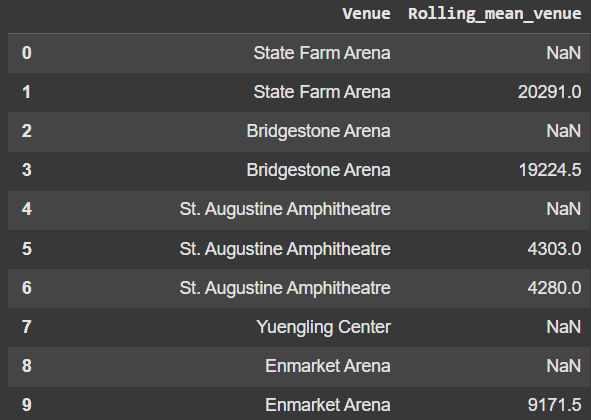
Utilizing a Groupby is another common usecase when working with rolling. Let’s groupby the venue and find the mean of tickets sold.
df['Rolling_mean_venue'] = df.groupby('Venue')['tickets_sold'].rolling(window=2).mean().reset_index(level=0, drop=True)
df[['Venue', 'Rolling_mean_venue']]
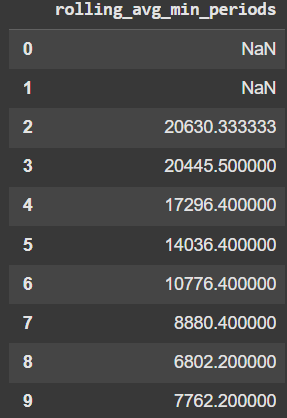
Example 8 - Min Periods
df['rolling_avg_min_periods'] = df['Capacity'].rolling(window=5, min_periods=3).mean()
df['rolling_avg_min_periods']
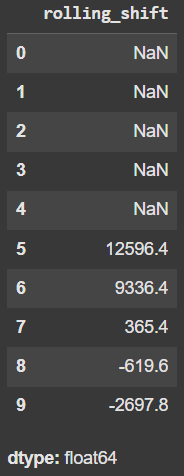
Example 9
You can also start building out more advanced rolling capabilities when utilizing shift. Shift allows you to look at data from rows above or below.
df['rolling_shift'] = df['Capacity'].rolling(window=5).mean().shift(1) - df['Capacity']
df['rolling_shift'].head(10)
Example 10
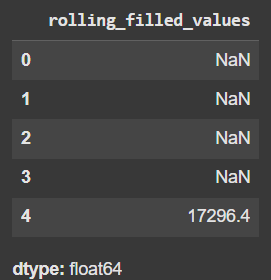
Besides min periods we can utilize a forward fill to help populate the missing null values.
df['rolling_filled_values'] = df['Capacity'].ffill().rolling(window=5).mean()
df['rolling_filled_values'].head()
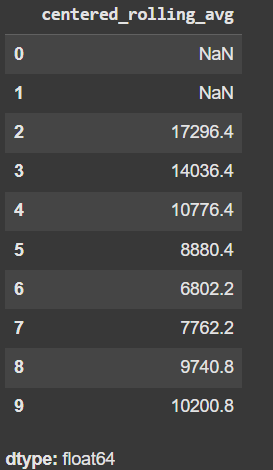
Example 11
df['centered_rolling_avg'] = df['Capacity'].rolling(window=5, center=True).mean()
df['centered_rolling_avg'].head(10)
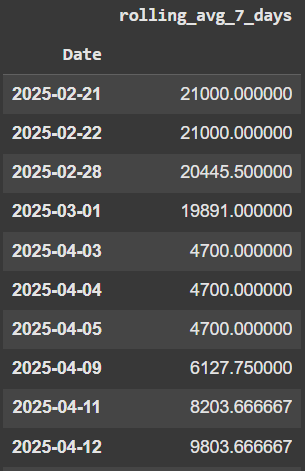
Example 12
Start off by converting the date into the index of the dataframe.
df['Date'] = pd.to_datetime(df['Date'])
df.set_index('Date', inplace=True)
Once the date index is set, pass in a day amount. For example 7D for one week.
df['rolling_avg_7_days'] = df['Capacity'].rolling('7D').mean()
df['rolling_avg_7_days']
Final Thoughts
Thanks for checking out this Pandas article. Make sure to read our other guides on the website!
