Using explode within Python Pnadas allows you to transform each element of a list to a new row within a dataframe.
Python Pandas Explode YouTube Video
If you want a video demonstration of how the code works, checkout the video below on our YouTube channel.
When working with Python Pandas the first step is to always import it. As an industry standard, use pd
import pandas as pd
To start we’re going to create a simple dataframe in python. We will be converting a quick dictionary I created showcasing different baseball cards.
					df = pd.DataFrame({  'card': ['1971 Nolan Ryan', '1928 Ogden Don Bradman', '1909 T206 Ty Cobb', '1887 Lone Jack Ben Franklin', '2005 Topps Justin Verlander'],
    'properties': [['Baseball', 'Vintage', 'Pitcher'], ['Cricket', 'Pre War'], ['Baseball', 'Pre War', 'Batter'], ['Non Sports', 'Pre War'], ['Baseball', 'Modern', 'Pitcher']]
                  })
df.head(10)
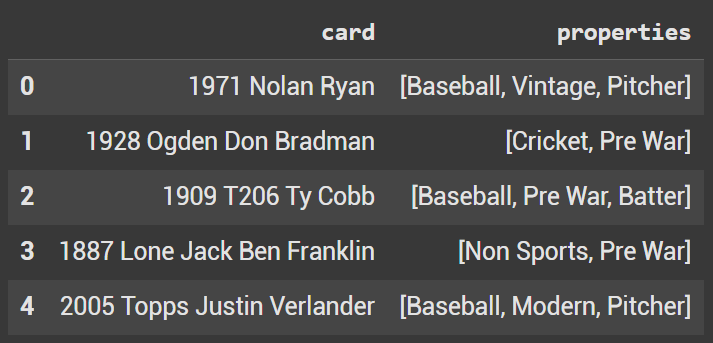
pd.dataframe created
Using Pandas Explode
To utilize explode use dataframe.explode()
The parameters are the column(s) that you want to explode & if you want to ignore index which by default is false.
In this example we are going to explode properties. As seen above properties shows as a list in the dataframe. For Example the T206 Ty Cobb card has properties of [Baseball, Pre War, Batter]
df = df.explode('properties')
Once Exploded, we should have each property on an individual line. Looking at the Cobb example once again, we can see that there are 3 rows associated with Cobb. Baseball, Pre War and Batter are now broken up.
df.head(10)
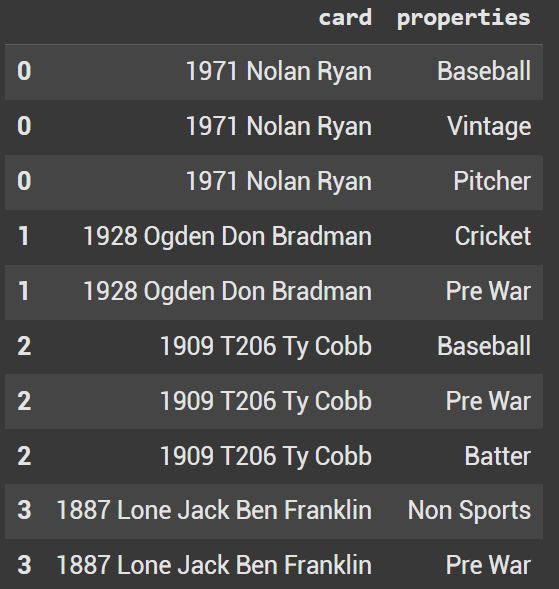
pd.dataframe exploded
Count Number of Pre War Cards
Now that we have a modified dataframe, we can easily count the number of cards that have a propery of Pre War. To do this we use .value_counts()
df['properties'].value_counts()['Pre War']
This above Pandas code prints out 3
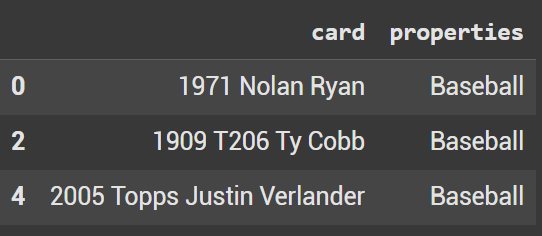
Filter only show name of baseball cards
It’s also quite easy now to filter specifically for baseball cards. In our initial dataframe we had Cricket and Nonsports. Using query we showcase the 3 cards that are baseball: 1971 Nolan Ryan, 1909 T206 Ty Cobb, and 2005 Topps Justin Verlander.
df.query('properties == "Baseball"')
Pivot Table
If we want to quickly look at a way to count each unique property, utilize a pivot table.
df.pivot_table(index='properties', values='card', aggfunc='count').reset_index().rename(columns = {'card':'count'}).sort_values('count', ascending = False)
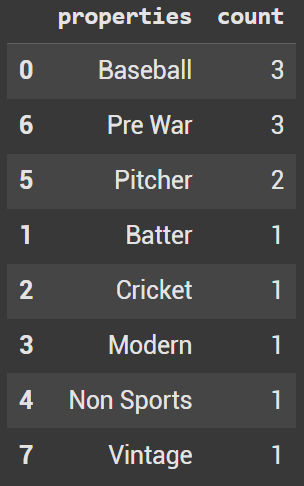
Pivot table created from the df dataframe
