We are going to be looking at Python Z-score.
Z-score tells us how far a data poin is from the mean.
To start we’re going to import the necessary libraries.
numpy as np, stats and pandas
					import numpy as np
from scipy import stats
import pandas as pd
Example 1 Numpy
Let’s create a list of numbers called data containing a sequence of integers.
data = [10, 12, 15, 18, 20, 21, 23, 25, 30, 32]
Next we calculate the average mean of the numbers in the data list using Numpy’s mean() function
mean = np.mean(data)
Here we compute the standard deviation of the data list using Numpy, measuring how spread out the numbers are from the mean
std_dev = np.std(data)
Here we calculate the z-scores for each value in data, showing how many standard deviations each value is from the mean
z_scores_manual = (data - mean) / std_dev
print(z_scores_manual)
Example 2 scipy much easier
Here we use SciPy’s built-in function to calculate the z-scores for all values in data
z_scores_scipy = stats.zscore(data)
print(z_scores_scipy)
Example 3 detect outliers with Pandas
Here we set the random seed in NumPy to 7, ensuring that any random numbers generated afterwards are reproducible.
np.random.seed(7)
This line generates 1,000 random numbers from a normal distribution with
loc=0: mean of 0
scale=1: standard deviation of 1
size=1000: total 1,000 values
data = np.random.normal(loc=0, scale=1, size=1000)
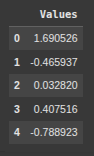
Next we create a Pandas DataFrame from the data array with a single column named “Values”, allowing for easier data analysis and manipulation.
df = pd.DataFrame(data, columns=['Values'])
df.head()
Herre we add a new column “Z-Score” to the DataFrame df, containing the z-score for each value in “Values”, showing how far each value is from the mean in terms of standard deviations.
df['Z-Score'] = (df['Values'] - df['Values'].mean()) / df['Values'].std()
Here we calculate the percentage of values in the DataFrame df that fall within
1 standard deviation of the mean “within_1_std”
2 standard deviations “within_2_std”
3 standard deviations “within_3_std”
					# Calculate the percentage of data within each standard deviation range
within_1_std = len(df[(df['Z-Score'] >= -1) & (df['Z-Score'] <= 1)]) / len(df) * 100
within_2_std = len(df[(df['Z-Score'] >= -2) & (df['Z-Score'] <= 2)]) / len(df) * 100
within_3_std = len(df[(df['Z-Score'] >= -3) & (df['Z-Score'] <= 3)]) / len(df) * 100
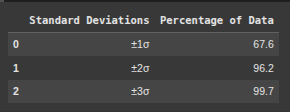
This code creates a summary called summary_df that nearly displays the standard deviation and percentage pf data within each range from previous calculations.
					# Display the results in a DataFrame
summary_df = pd.DataFrame({
    'Standard Deviations': ['±1σ', '±2σ', '±3σ'],
    'Percentage of Data': [within_1_std, within_2_std, within_3_std]
})
summary_df
Here we create a new column called “Outlier” in the df DataFrame, marking True for values whose z-score is greater than 3 or less than -3
df['Outlier'] = (df['Z-Score'] > 3) | (df['Z-Score'] < -3)
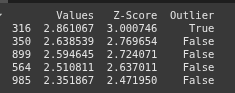
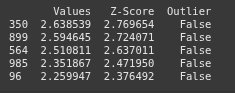
Here we sort th DataFrame df ny thr “Z-score” column in descending order and selects the top 5 rows, which represent the 5 most extreme high values in the dataset
top_5_highest = df.sort_values(by='Z-Score', ascending=False).head(5)
print(top_5_highest)
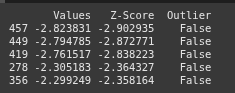
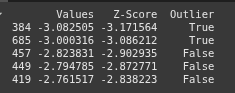
This line sorts df by ‘Z-Score’ in ascending order and selects the top 5 rows, showing the 5 most extreme low values
top_5_lowest = df.sort_values(by='Z-Score', ascending=True).head(5)
print(top_5_lowest)
This line removes outliers from the DataFrame df and saves the result in a new DataFrame “df_no_outliers”
df_no_outliers = df[df['Outlier'] == False].copy()
print(top_5_highest_no_outlier)
This line extracts the top 5 lowest Z-Score entries excluding the outliers from the DataFrame
top_5_lowest_no_outlier = df_no_outliers.sort_values(by='Z-Score', ascending=True).head(5)
print(top_5_lowest_no_outlier)