Optuna is a hyperparameter optimization framework for machine learning models. It can help automate and streamline the process of tuning the hyperparameters.
It’s quite popular among Kaggle users and you’ll see it used within competitions.
In this article, we will go over an example of using it on a basic dataset. There is also a YouTube video if you want to watch a video instead of reading an article.
Before we start, we are going to have to import a few things.
					import seaborn as sns
import pandas as pd
from sklearn.model_selection import train_test_split
from sklearn.ensemble import RandomForestRegressor
from sklearn.metrics import mean_absolute_error, mean_squared_error, r2_score
import optuna
from sklearn.model_selection import cross_val_score
import matplotlib.pyplot as plt
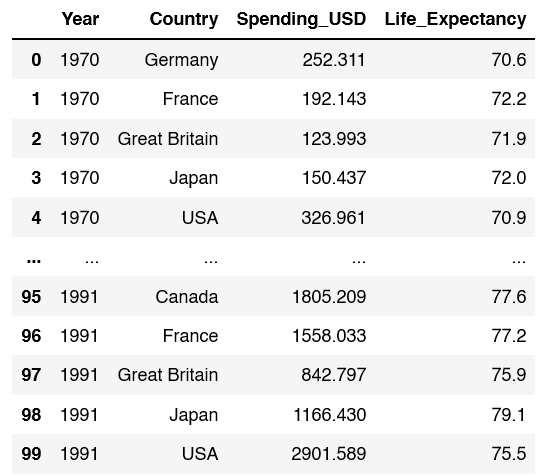
Now it’s time to create a dataframe. We are going to load the healthexp dataset from seaborn
					healthexp = sns.load_dataset('healthexp')
healthexp.head(100)
healthexp = pd.get_dummies(healthexp)
Now it’s time to split our data into X and Y dataframes. On the X side of things, drop the target which is Life Expectancy. Y set to Life Expectancy.
X = healthexp.drop(['Life_Expectancy'], axis=1)
y = healthexp['Life_Expectancy']
Now set up train test split with a test_size of 0.2. Feel free to choose a random_state of your liking.
X_train, X_test, y_train, y_test = train_test_split(X, y, test_size=0.2, random_state=19)
For this article, we are going to use a basic Random Forest Regressor.
rfr = RandomForestRegressor(random_state=13)
rfr.fit(X_train, y_train)
y_pred = rfr.predict(X_test)
Now that we fit the model and ran a prediction, let’s take a look at a few statistics. In particular mean absolute error, mean squared error, and the r2 score.
mean_absolute_error(y_test, y_pred)
MAE: 0.25916363636361917
mean_squared_error(y_test, y_pred)
MSE: 0.10221141818181628
r2_score(y_test, y_pred)
R2: 0.9910457602615238
With these benchmarks, let’s take a look at using Optuna
Optuna Example
The first thing we need to do is define an objective function. Inside the function create the hyperparameters you want to test.
def objective(trial):

n_estimators = trial.suggest_int('n_estimators', 100, 1000)
max_depth = trial.suggest_int('max_depth', 10, 50)
min_samples_split = trial.suggest_int('min_samples_split', 2, 32)
min_samples_leaf = trial.suggest_int('min_samples_leaf', 1, 32)

model = RandomForestRegressor(n_estimators=n_estimators,
max_depth=max_depth,
min_samples_split=min_samples_split,
min_samples_leaf=min_samples_leaf)

score = cross_val_score(model, X, y, n_jobs=-1, cv=5, scoring='neg_mean_squared_error').mean()
Then we create a study. I’m going to use seed=42.
study = optuna.create_study(direction='maximize', sampler=optuna.samplers.RandomSampler(seed=42)) # Default is random Search
Optimize your study, send in the parameters of objective and the amount of trials.
study.optimize(objective, n_trials=100)
Next grab the best hyper parameters and values.
					best_params = study.best_params
print(f"Best Hyperparameters: {best_params}")
Best Hyperparameters: {‘n_estimators’: 358, ‘max_depth’: 34, ‘min_samples_split’: 2, ‘min_samples_leaf’: 2}
					best_score = study.best_value
print(f"Best Accuracy: {best_score:.3f}")
Best Accuracy: -1.860
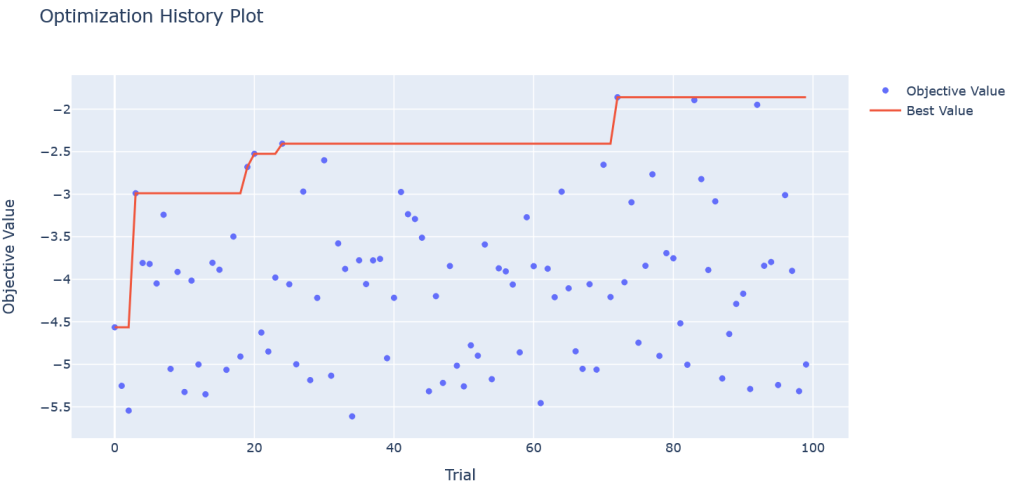
Visualizing the Optuna Results
optuna.visualization.plot_optimization_history(study)
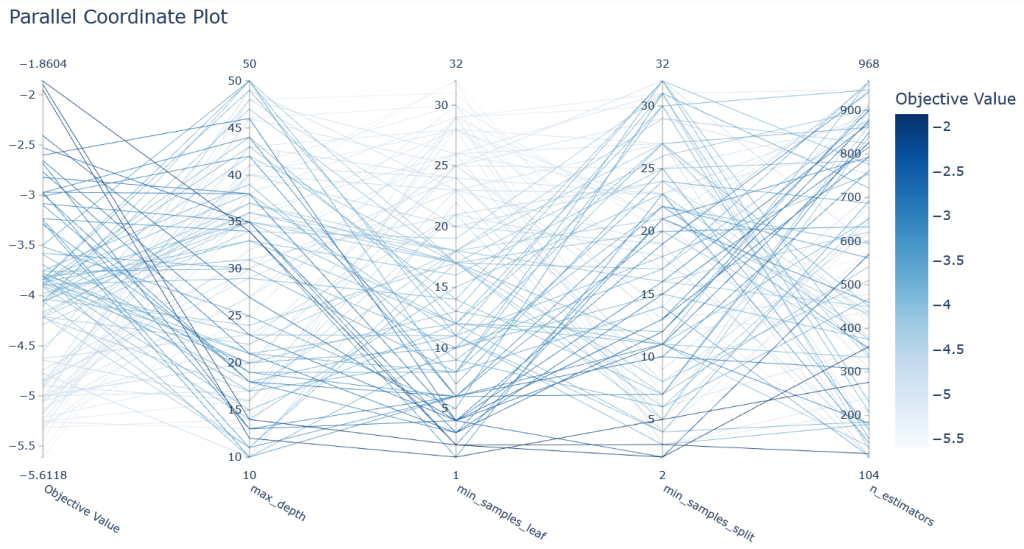
optuna.visualization.plot_parallel_coordinate(study)
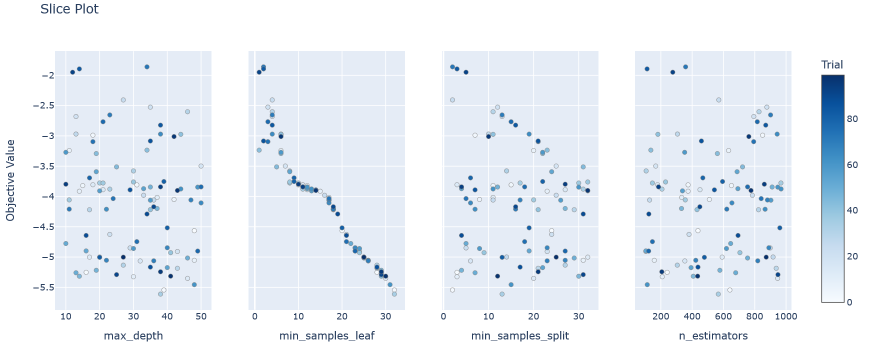
optuna.visualization.plot_slice(study, params=['n_estimators', 'max_depth', 'min_samples_leaf', 'min_samples_split'])
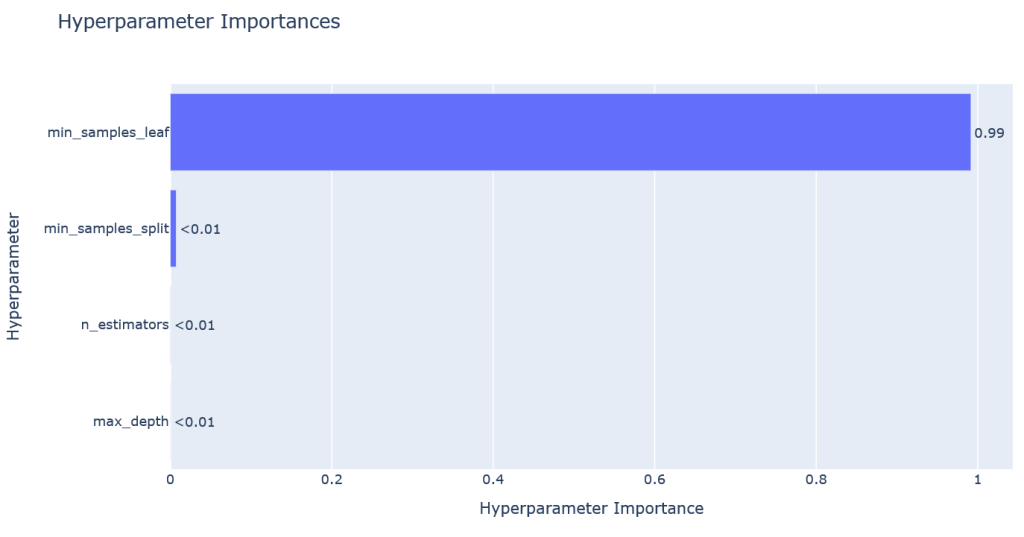
optuna.visualization.plot_param_importances(study)
Lets grab each hyperparameter from the dictionary.
best_n_estimators = best_params['n_estimators']
best_max_depth = best_params['max_depth']
best_min_samples_split = best_params['min_samples_split']
best_min_samples_leaf = best_params['min_samples_leaf']
Then lets rebuild our random forest regressor with the parameters from optuna.
best_model = RandomForestRegressor(n_estimators=best_n_estimators,
max_depth=best_max_depth,
min_samples_split=best_min_samples_split,
min_samples_leaf=best_min_samples_leaf)
best_model.fit(X_train, y_train)
y_pred = best_model.predict(X_test)
Let’s compare the results to what we had earlier
mean_absolute_error(y_test, y_pred)
MAE: 0.3089099265527784
mean_squared_error(y_test, y_pred)
MSE: 0.13917245887029073
r2_score(y_test, y_pred)
R2: 0.9878077852368601
