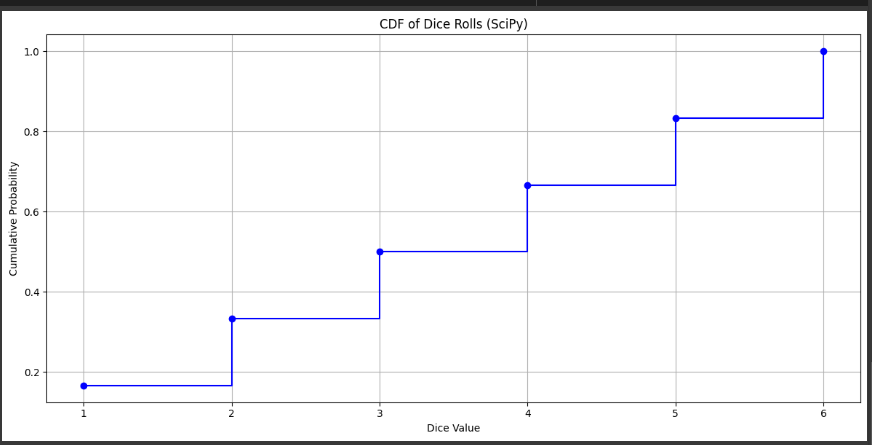
uniform distribution python

Table of Contents

				
					import numpy as np
import matplotlib.pyplot as plt
from scipy.stats import randint


					np.random.seed(11)


Example 1 Random Numbers 0 to 1

				
					data = np.random.uniform(size=250)


					print(data)


Example 2 Generate Dice Rolls

				
					n_rolls = 1000


					rolls = np.random.randint(1, 7, size=n_rolls)


					print(rolls)


Example 3 Data Points

				
					# Calculate the mean, variance, and standard deviation
mean_rolls = np.mean(rolls)


					print(mean_rolls)


					var_rolls = np.var(rolls)


					print(var_rolls)


					std_rolls = np.std(rolls)


					print(std_rolls)


Example 4 Histogram Plot

				
					# Plot the histogram
plt.hist(rolls, bins=np.arange(1, 8) - 0.5, edgecolor='black', rwidth=0.8)
plt.xlabel('Dice Value')
plt.ylabel('Frequency')
plt.title(f'Histogram of {n_rolls} Dice Rolls')
plt.xticks(np.arange(1, 7))
plt.grid(axis='y', linestyle='--', alpha=0.7)

# Show the plot
plt.show()


Example 5 Calculate PMF

				
					dice_distribution = randint(1, 7)


					values = np.arange(1, 7)


					# Calculate the PDF using SciPy (for a discrete uniform distribution)
pmf_scipy = dice_distribution.pmf(values)


					# Plot the PMF using SciPy
plt.figure(figsize=(12, 6))
plt.bar(values, pmf_scipy, width=0.5, edgecolor='black', alpha=0.7)
plt.title('PMF of Dice Rolls (SciPy)')
plt.xlabel('Dice Value')
plt.ylabel('Probability')


Example 6 Calculate CDF

				
					# Calculate the CDF using SciPy
cdf_scipy = dice_distribution.cdf(values)


					# Plot the CDF using SciPy
plt.figure(figsize=(12, 6))
plt.step(values, cdf_scipy, where='post', label='CDF', color='b', marker='o')
plt.title('CDF of Dice Rolls (SciPy)')
plt.xlabel('Dice Value')
plt.ylabel('Cumulative Probability')
plt.grid(True)
plt.tight_layout()
plt.show()


Free Community

Join 1,000+ AI Automation Builders

Weekly tutorials, live calls & direct access to Ryan & Matt.

Join Free →

Keep Learning

python quantiles statistics

In Python, a quantile is a statistical term used to describe a point or value below which a certain proportion of the...

python variance and standard deviation

https://youtu.be/p4H2b2x_nWc#population and sample variance/std deviationVariance measures how far each data point in the set is from the mean andthus from every other...

Python Z-Score

We are going to be looking at Python Z-score. Z-score tells us how far a data poin is from the mean. https://youtu.be/QjG1ljFNF9U...

Spearman Rank Correlation

Spearman Rank Correlation [Simply explained] https://youtu.be/TNQTd9gR1c0 Example 2 Fast wth scipy