Streamlit can help businesses automate a ton of tasks in a short amount of time. It essentially is a quick UI you can throw on top of Python code allowing you to build models and spreadsheet calculations very quickly.
In this streamlit course we are going to cover the basics of Streamlit from creating your first app to building 4 projects that cover APIs and AI.
Below is a full YouTube video you can watch in parallel with this tutorial. Also if you need any Streamlit help, I’m taking on customers.
How to use Streamlit
1-1
pip install streamlit&streamlit hello→ Installs Streamlit and runs its demo app.st.hello()→ Shows a built-in welcome message in the browser.st.title()→ Displays a title on the page.st.text_input()→ Creates a text box for user input.st.write()→ Displays text or data dynamically.print("Script executed!")→ Prints to terminal each time the script re-runs (Streamlit re-executes the whole script on any interaction).
# ------ Installing and launching Streamlit ------
# In terminal:
# pip install streamlit
# streamlit hello
# ------ streamlit run
# ------ Running your first app ------
import streamlit as st
st.hello()
# Save the file (e.g., app.py) and show web again in browser.
# ------ streamlit run
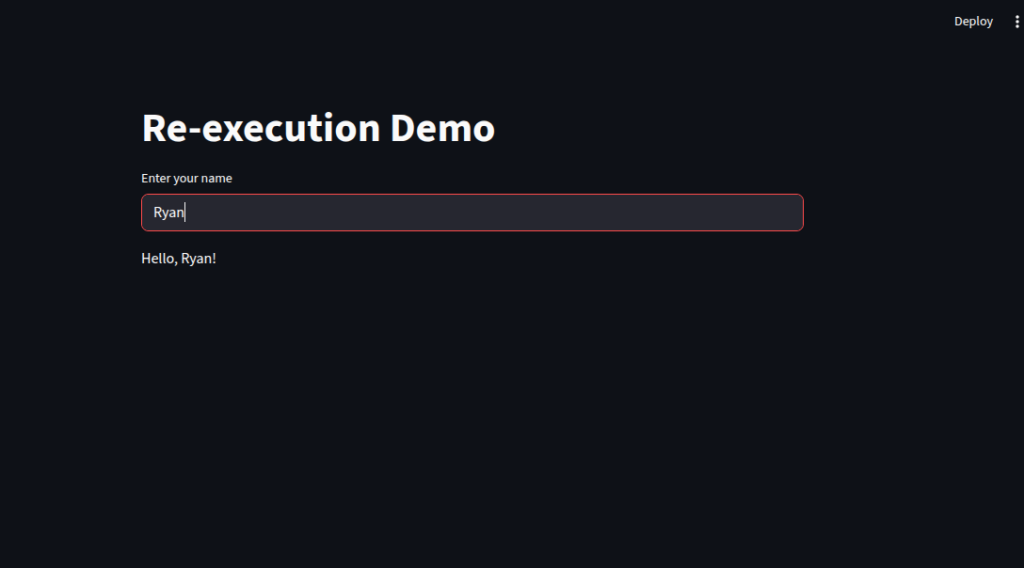
# ------ Understanding Streamlit's re-execution model ------
st.title("Re-execution Demo")
name = st.text_input("Enter your name")
if name:
st.write(f"Hello, {name}!")
else:
st.write("Please type your name above.")
print("Script executed!")
# Save the file and refresh the web app to see changes.
# ------ streamlit run
1-2
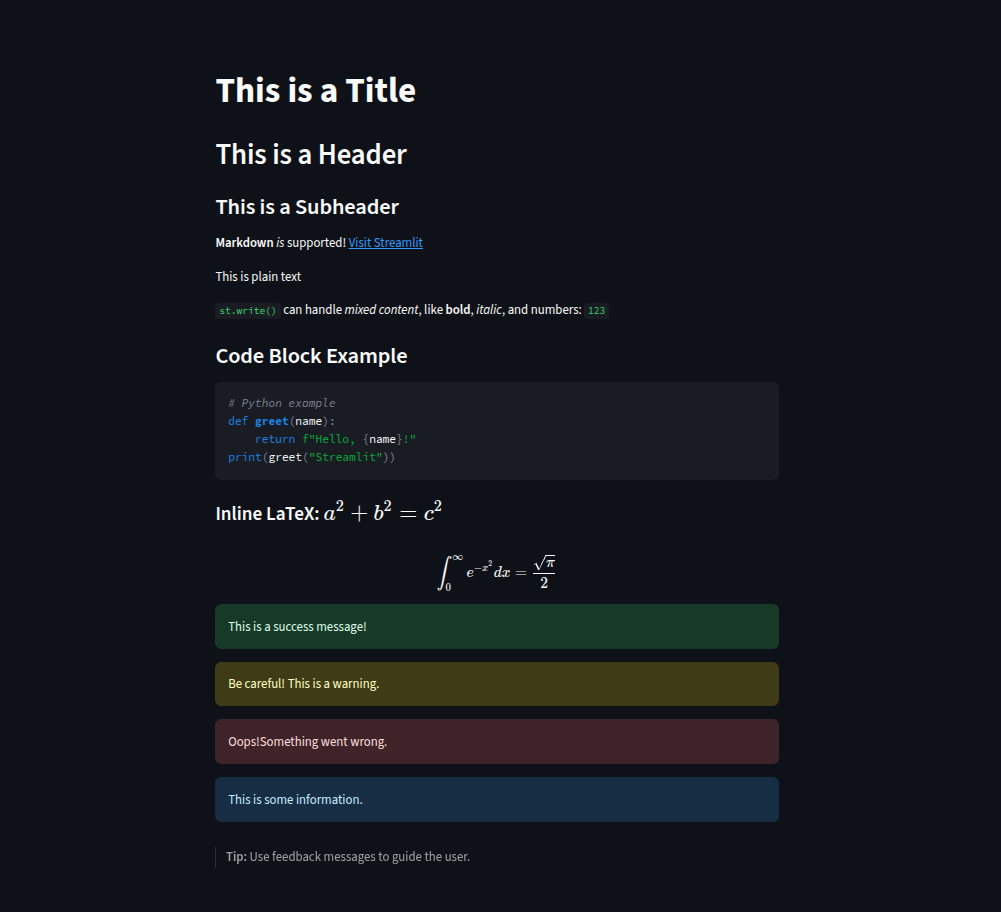
Streamlit makes it simple to display styled text, formatted code, math equations, and helpful feedback messages in your web app.
1. Adding Headings and Basic Text
st.title()creates a large page title.st.header()andst.subheader()display progressively smaller section headings.st.text()is for plain, unformatted text.st.markdown()supports Markdown formatting — letting you add bold, italic, hyperlinks, lists, and more.st.write()is the most flexible — it can handle text, numbers, and even styled Markdown in a single call.
2. Showing Code and Math
st.code()displays code blocks with optional syntax highlighting.st.latex()renders mathematical expressions using LaTeX syntax, ideal for equations and scientific notations.
3. Providing User Feedback
Streamlit includes built-in alert boxes for better user guidance:
st.success()— Positive confirmation messages.st.warning()— Cautionary notices.st.error()— Error or failure alerts.st.info()— General informational tips.
					# ------ Using elements: title, header, subheader, markdown, text ------
import streamlit as st

st.title("This is a Title")
st.header("This is a Header")
st.subheader("This is a Subheader")

st.markdown("**Markdown** _is_ supported! [Visit Streamlit](https://streamlit.io)")
st.text("This is plain text")
st.write("`st.write()` can handle *mixed content*, like **bold**, _italic_, and numbers:", 123)

# Save the file and show web again.
# ------ streamlit run


# ------ Displaying formatted text, code blocks, and LaTeX ------
st.markdown("### Code Block Example")
st.code("""
# Python example
def greet(name):
    return f"Hello, {name}!"
print(greet("Streamlit"))
""", language="python")

st.markdown("#### Inline LaTeX: $a^2 + b^2 = c^2$")
st.latex(r"\int_0^\infty e^{-x^2} dx = \frac{\sqrt{\pi}}{2}")

# Save and refresh the web app.
# ------ streamlit run


# ------ Showing feedback messages ------
st.success("This is a success message!")
st.warning("Be careful! This is a warning.")
st.error("Oops! Something went wrong.")
st.info("This is some information.")

# Adding a helpful tip:
st.markdown("> **Tip:** Use feedback messages to guide the user.")

# Save and refresh again.
# ------ streamlit run
1-3
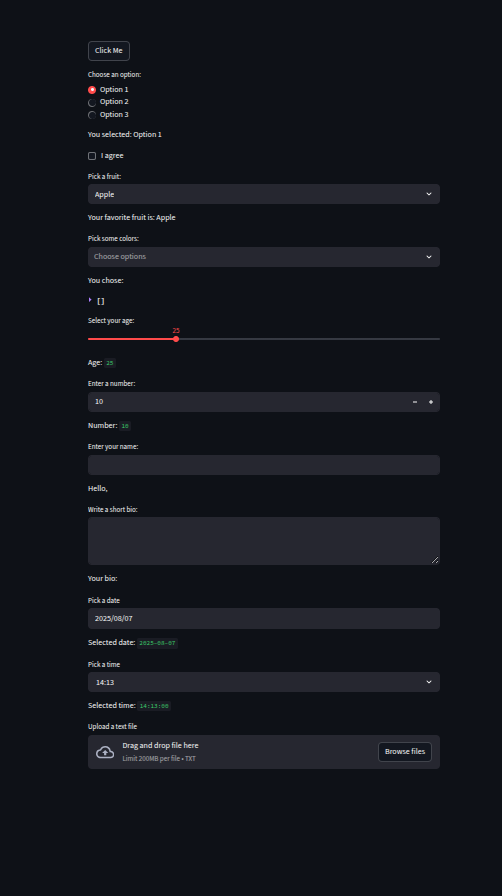
We use buttons, radio buttons, and checkboxes for quick actions and user choices.
We add
selectboxandmultiselectdropdowns for single or multiple selections.We include sliders, number inputs, text inputs, and text areas to capture different kinds of user input.
We provide date pickers and time pickers so users can select schedules.
We implement a file uploader that accepts
.txtfiles, reads their content, and displays it inside a scrollable text area.We take advantage of Streamlit’s automatic script re-run so every interaction updates the app instantly without page reloads.
					# ------ Basic interaction: button, radio, checkbox ------
import streamlit as st

if st.button("Click Me"):
    st.write("Button clicked!")

choice = st.radio("Choose an option:", ["Option 1", "Option 2", "Option 3"])
st.write("You selected:", choice)

agree = st.checkbox("I agree")
if agree:
    st.write("Thanks for agreeing!")

# Save and refresh.
# ------ streamlit run


# ------ Selectors: selectbox, multiselect ------
fruit = st.selectbox("Pick a fruit:", ["Apple", "Banana", "Orange"])
st.write("Your favorite fruit is:", fruit)

colors = st.multiselect("Pick some colors:", ["Red", "Green", "Blue", "Yellow"])
st.write("You chose:", colors)

# Save and refresh.
# ------ streamlit run


# ------ User inputs: slider, number input, text input, text area ------
age = st.slider("Select your age:", 0, 100, 25)
st.write("Age:", age)

number = st.number_input("Enter a number:", min_value=0, max_value=100, value=10)
st.write("Number:", number)

name = st.text_input("Enter your name:")
st.write("Hello,", name)

bio = st.text_area("Write a short bio:")
st.write("Your bio:", bio)

# Save and refresh.
# ------ streamlit run


# ------ Date and time pickers ------
date = st.date_input("Pick a date")
st.write("Selected date:", date)

time = st.time_input("Pick a time")
st.write("Selected time:", time)

# Save and refresh.
# ------ streamlit run


# ------ File uploader for reading external files ------
uploaded_file = st.file_uploader("Upload a text file", type=["txt"])

if uploaded_file is not None:
    content = uploaded_file.read().decode("utf-8")
    st.text_area("File Content", content, height=200)

# Save and refresh.
# ------ streamlit run
1-4
Streamlit makes working with data effortless, whether you’re showing static tables, interactive grids, or structured JSON.
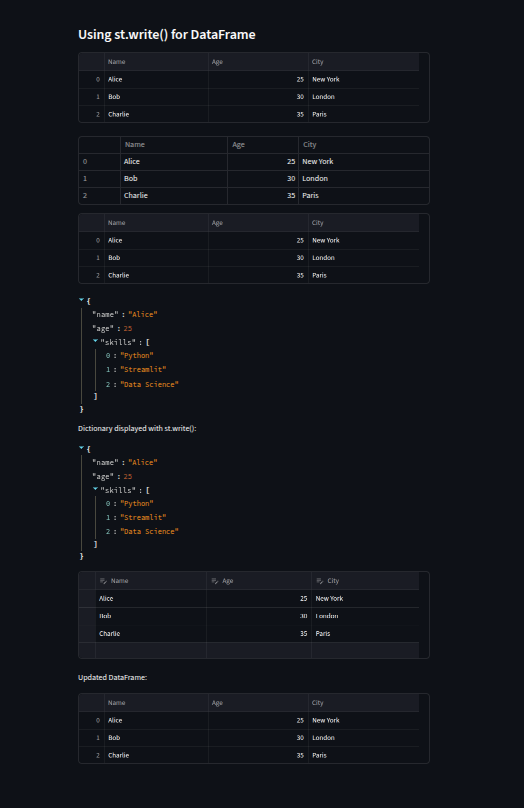
Displaying DataFrames and Tables
We can usest.write()to quickly render a Pandas DataFrame directly in the app. For more control,st.table()creates a static, non-scrollable table, whilest.dataframe()produces a scrollable, interactive table where columns can be resized and sorted.Working with JSON and Dictionaries
When dealing with structured data,st.json()presents it in a clean, collapsible, and syntax-highlighted format. We can also display dictionaries usingst.write()for a more raw output.Editing Data in the Browser
Withst.data_editor(), we can make DataFrames editable directly inside the app. Thenum_rows="dynamic"option even allows users to add or remove rows in real time, making it perfect for lightweight data entry or quick corrections.
By combining these tools, we can not only present data neatly but also let users interact with and modify it — all from within the browser, without additional UI code.
					# ------ Showing tables and dataframes ------
import streamlit as st
import pandas as pd

data = {
    "Name": ["Alice", "Bob", "Charlie"],
    "Age": [25, 30, 35],
    "City": ["New York", "London", "Paris"]
}
df = pd.DataFrame(data)

st.write("### Using st.write() for DataFrame")
st.write(df)

st.table(df)  # Static table
st.dataframe(df)  # Scrollable and interactive

# Save and refresh.
# ------ streamlit run


# ------ Displaying JSON and dictionaries ------
person = {
    "name": "Alice",
    "age": 25,
    "skills": ["Python", "Streamlit", "Data Science"]
}

st.json(person)  # Pretty JSON format
st.write("Dictionary displayed with st.write():", person)

# Save and refresh.
# ------ streamlit run


# ------ Using editable tables with data editor ------
editable_df = st.data_editor(df, num_rows="dynamic")  # Editable in the browser
st.write("Updated DataFrame:")
st.write(editable_df)

# Save and refresh.
# ------ streamlit run
1-5
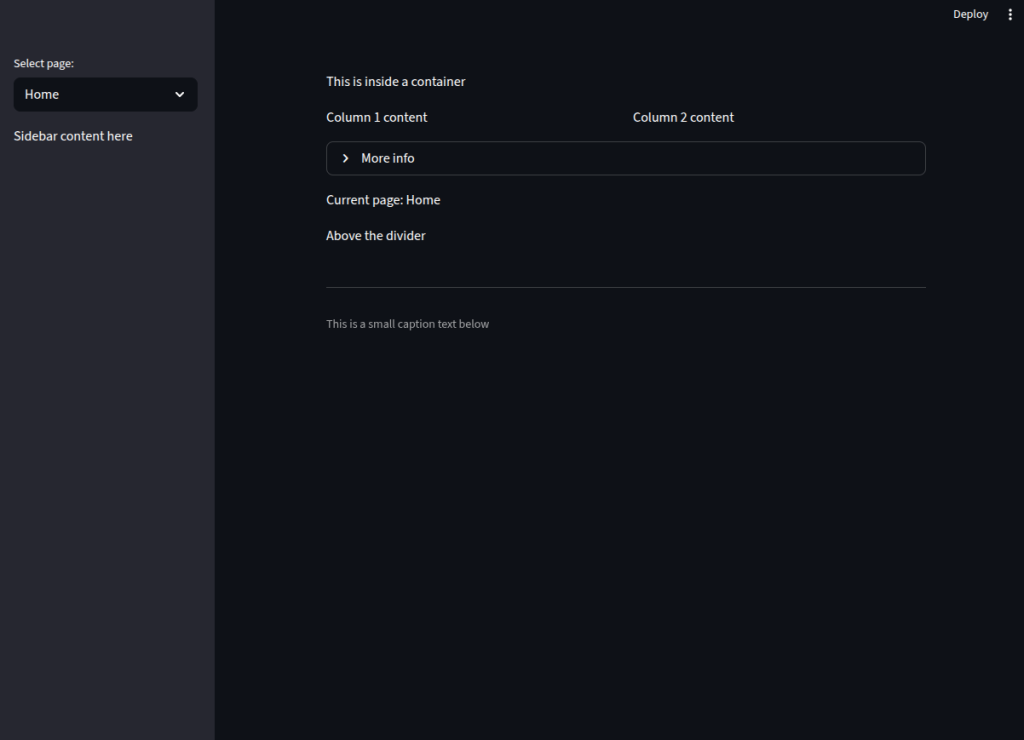
A clean and well-structured layout makes Streamlit apps easier to use, and Streamlit provides built-in tools to organize content without external CSS or HTML.
Containers
st.container()groups related elements together. Anything placed inside a container stays visually grouped, which is helpful for separating different sections of an app.Columns
st.columns()splits the page into multiple vertical sections. For example,st.columns(2)creates two side-by-side areas where we can place different content in each.Expanders
st.expander()hides content until the user clicks to reveal it, which is useful for optional or advanced details.Sidebar
Thest.sidebarnamespace allows us to place elements on a collapsible side panel. This is perfect for navigation menus, filters, or settings that should be accessible but not clutter the main page.Dividers and Captions
st.divider()draws a horizontal line to separate sections, andst.caption()adds small, low-emphasis text that can be used for hints or additional notes.
					# ------ Organizing apps: container, columns, expander ------
import streamlit as st

with st.container():
    st.write("This is inside a container")

col1, col2 = st.columns(2)
with col1:
    st.write("Column 1 content")
with col2:
    st.write("Column 2 content")

with st.expander("More info"):
    st.write("Hidden content revealed when expanded")

# Save and refresh.
# ------ streamlit run


# ------ Sidebar integration for navigation and filters ------
option = st.sidebar.selectbox("Select page:", ["Home", "Settings", "About"])
st.sidebar.write("Sidebar content here")

st.write(f"Current page: {option}")

# Save and refresh.
# ------ streamlit run


# ------ Dividers and captions for clean layout ------
st.write("Above the divider")
st.divider()  # horizontal line

st.caption("This is a small caption text below")

# Save and refresh.
# ------ streamlit run
1-6
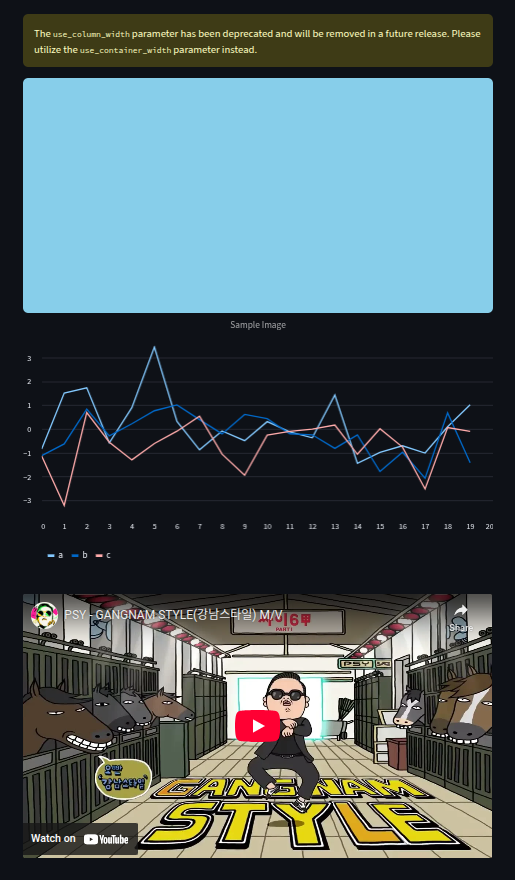
Streamlit makes it easy to integrate images, charts, and media files into your app, helping you present data and content in a visually engaging way.
Images
Withst.image(), we can display local images, generated images, or URLs. In this example, we use Pillow (PIL.Image) to create a simple sky-blue image and display it with a caption. Theuse_column_width=Trueoption ensures the image scales to fit the layout.Charts
Streamlit includes quick chart functions likest.line_chart(), which can directly plot a Pandas DataFrame. Here, we generate random data with NumPy, convert it to a DataFrame, and instantly render a line chart.Audio and Video Playback
st.audio()plays audio files in formats like MP3 or WAV.st.video()supports local video files or embedded streams.
In the example, file reading is commented out for demonstration, but enabling it allows direct playback inside the app.
Embedding External Videos
We can pass a YouTube link (or other supported platforms) directly tost.video()to embed streaming content without downloads or extra HTML.
					# ------ Displaying images and charts ------
import streamlit as st
from PIL import Image
import pandas as pd
import numpy as np
import matplotlib.pyplot as plt

# Display image
img = Image.new('RGB', (200, 100), color='skyblue')
st.image(img, caption="Sample Image", use_column_width=True)

# Simple line chart
data = pd.DataFrame(np.random.randn(20, 3), columns=['a', 'b', 'c'])
st.line_chart(data)

# Save and refresh.
# ------ streamlit run


# ------ Playing audio and video files ------
audio_file = open("sample_audio.mp3", "rb") if False else None  # Replace False with True to test locally
video_file = open("sample_video.mp4", "rb") if False else None  # Replace False with True to test locally

if audio_file:
    st.audio(audio_file.read(), format='audio/mp3')

if video_file:
    st.video(video_file.read())

# Save and refresh.
# ------ streamlit run


# ------ Embedding YouTube or external video ------
st.video("https://www.youtube.com/watch?v=9bZkp7q19f0")  # Example YouTube link

# Save and refresh.
# ------ streamlit run
1-7
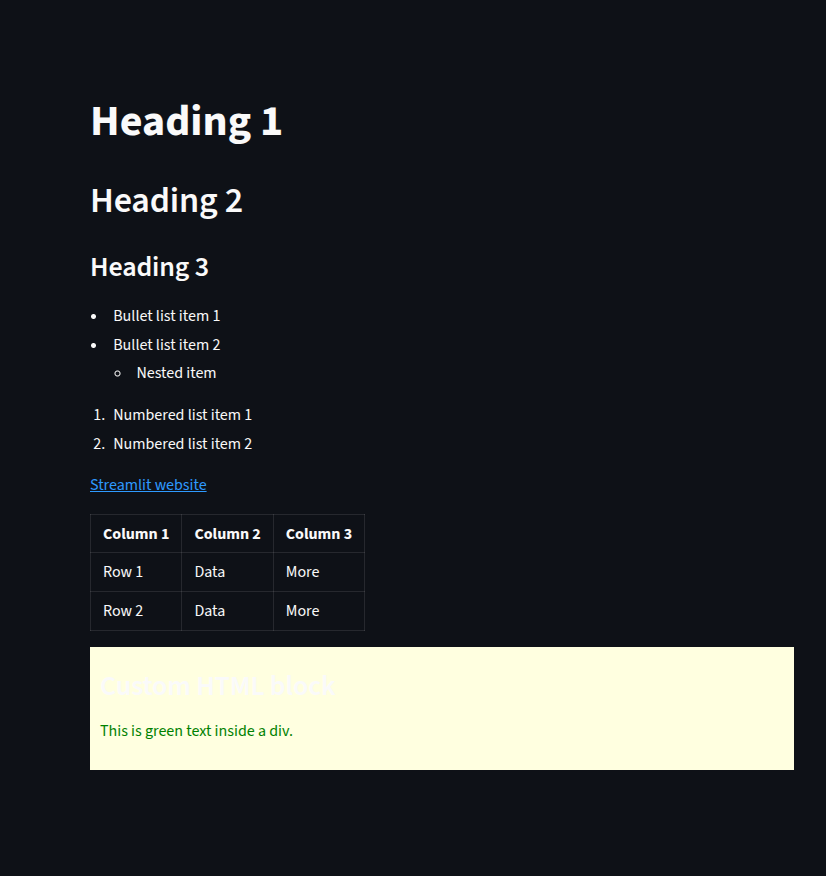
Markdown is one of the easiest ways to style and structure text in Streamlit, and it works seamlessly without extra formatting libraries.
Headings
We can create headings using#,##, and###for different levels, giving our content a clear hierarchy.Lists
Markdown supports both bullet lists (-or*) and numbered lists (1.,2.). Nested items can be indented for subpoints.Links
Hyperlinks can be added in the form[text](URL), making it easy to direct users to other pages.Tables
Using the pipe|and dash-syntax, we can create simple text-based tables that Streamlit renders cleanly in the app.Embedding Raw HTML
For advanced customization, we can pass HTML code directly tost.markdown()withunsafe_allow_html=True. This allows for custom styles, colors, and layouts, but should be used carefully to avoid security issues.
By combining Markdown’s simplicity with the flexibility of HTML, we can design rich text layouts in Streamlit without needing separate CSS or frontend frameworks.
					# ------ Using markdown for headings, lists, links, and tables ------
import streamlit as st

st.markdown("# Heading 1")
st.markdown("## Heading 2")
st.markdown("### Heading 3")

st.markdown("""
- Bullet list item 1
- Bullet list item 2
  - Nested item
1. Numbered list item 1
2. Numbered list item 2

[Streamlit website](https://streamlit.io)

| Column 1 | Column 2 | Column 3 |
| -------- | -------- | -------- |
| Row 1    | Data     | More     |
| Row 2    | Data     | More     |
""")

# Save and refresh.
# ------ streamlit run


# ------ Embedding raw HTML (with caution) ------
# HTML rendering can be risky - use carefully.
html_code = """
<div style='background-color: lightyellow; padding: 10px;'>
  <h3>Custom HTML block</h3>
  <p style='color: green;'>This is green text inside a div.</p>
</div>
"""
st.markdown(html_code, unsafe_allow_html=True)

# Save and refresh.
# ------ streamlit run
1 Project
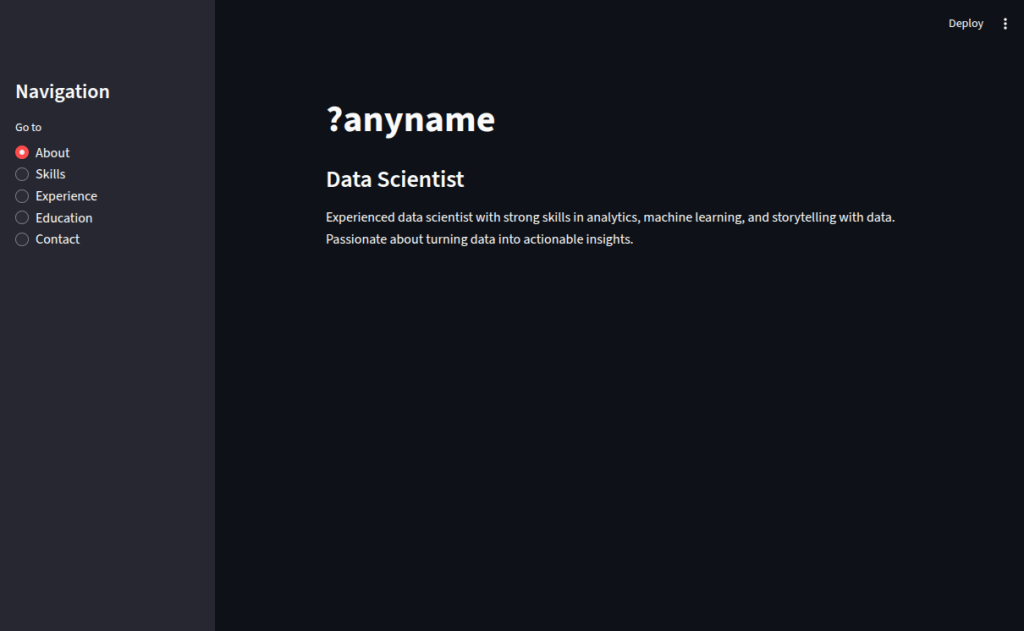
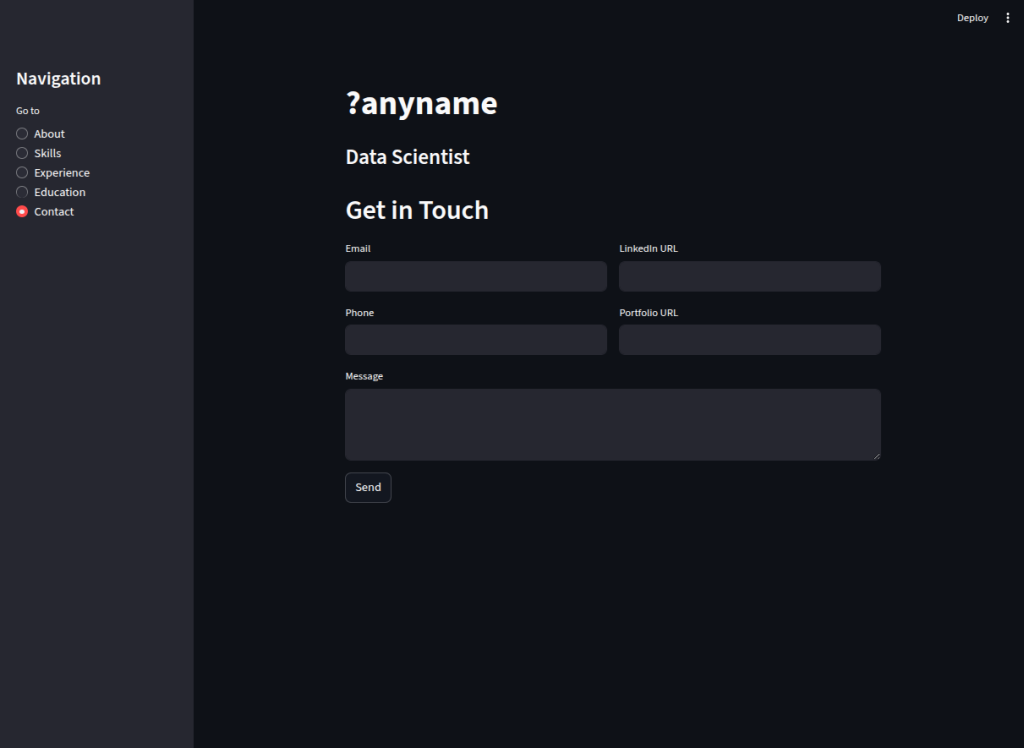
With Streamlit’s interactive widgets and layout features, we can create a dynamic resume app that lets users navigate through different sections of our profile.
Sidebar Navigation
We usest.sidebar.radio()to allow users to switch between sections like About, Skills, Experience, Education, and Contact.About Section
A short professional summary is displayed usingst.markdown()to provide an introduction.Skills Section
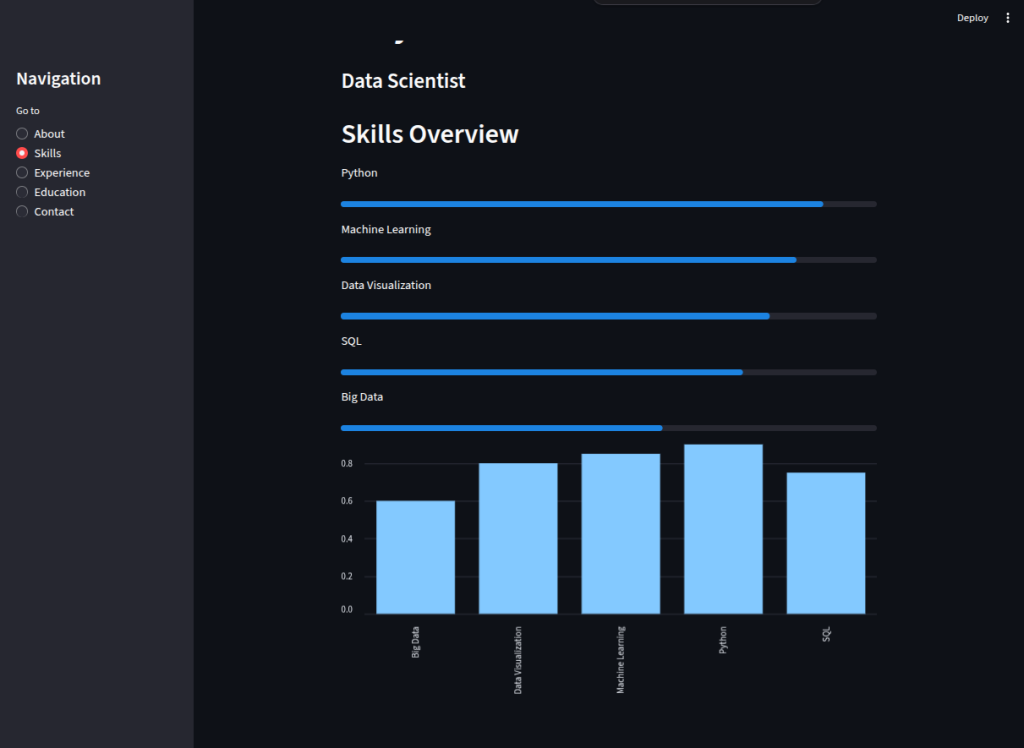
Skills are stored in a dictionary with proficiency levels (0–1 scale). We display each skill with a progress bar (st.progress()) and visualize them as a bar chart withst.bar_chart().Experience Section
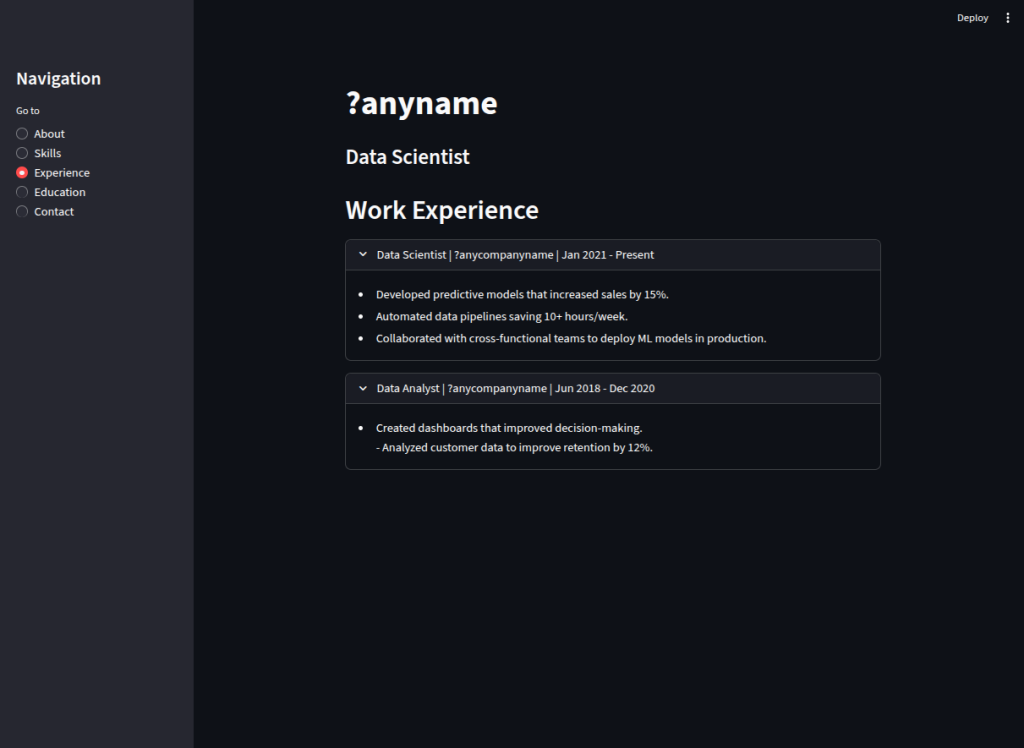
Work experience entries are wrapped inst.expander()widgets, letting users click to reveal detailed bullet points without cluttering the page.Education Section
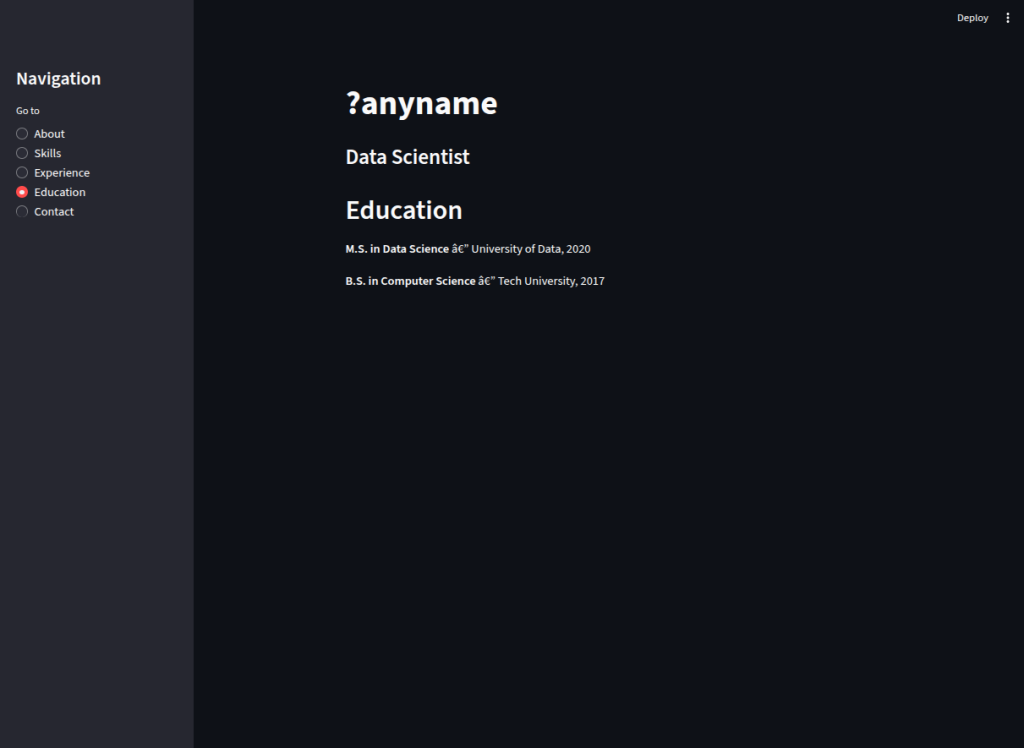
Academic qualifications are listed with bold formatting for degrees and universities.Contact Section
Input fields (st.text_input()andst.text_area()) collect contact details and a message. Ast.button()triggers a success message upon submission.
This kind of interactive resume not only looks professional but also allows recruiters or clients to explore our profile in a structured, user-friendly way.
					# ------ Personal Resume App (Advanced with placeholders) ------
import streamlit as st
import pandas as pd

# Sidebar for navigation
st.sidebar.title("Navigation")
section = st.sidebar.radio("Go to", ["About", "Skills", "Experience", "Education", "Contact"])

# Data for skills
skills = {
    "Python": 0.9,
    "Machine Learning": 0.85,
    "Data Visualization": 0.8,
    "SQL": 0.75,
    "Big Data": 0.6,
}

# Header with name and title
st.title("?anyname")
st.subheader("Data Scientist")

if section == "About":
    st.markdown(f"""
    Experienced data scientist with strong skills in analytics, machine learning, and storytelling with data.
    Passionate about turning data into actionable insights.
    """)

elif section == "Skills":
    st.header("Skills Overview")
    for skill, level in skills.items():
        st.write(f"{skill}")
        st.progress(level)
    df_skills = pd.DataFrame({
        "Skill": list(skills.keys()),
        "Proficiency": list(skills.values())
    })
    st.bar_chart(df_skills.set_index("Skill")) #I will write a section and more about plotting in streamlit in the intermediate section, now we can just add it I guess


elif section == "Experience":
    st.header("Work Experience")

    with st.expander(f"Data Scientist | ?anycompanyname | Jan 2021 - Present"):
        st.write(f"""
        - Developed predictive models that increased sales by 15%.
        - Automated data pipelines saving 10+ hours/week.
        - Collaborated with cross-functional teams to deploy ML models in production.
        """)

    with st.expander(f"Data Analyst | ?anycompanyname | Jun 2018 - Dec 2020"):
        st.write(f"""
        - Created dashboards that improved decision-making.
        - Analyzed customer data to improve retention by 12%.
        """)

elif section == "Education":
    st.header("Education")
    st.write(f"**M.S. in Data Science** — University of Data, 2020")
    st.write(f"**B.S. in Computer Science** — Tech University, 2017")

elif section == "Contact":
    st.header("Get in Touch")
    col1, col2 = st.columns(2)
    with col1:
        email = st.text_input("Email")
        phone = st.text_input("Phone")
    with col2:
        linkedin = st.text_input("LinkedIn URL")
        portfolio = st.text_input("Portfolio URL")

    message = st.text_area("Message")

    if st.button("Send"):
        st.success("Thanks for reaching out! I'll get back to you soon.")

# Save and refresh.
# ------ streamlit run
2-1
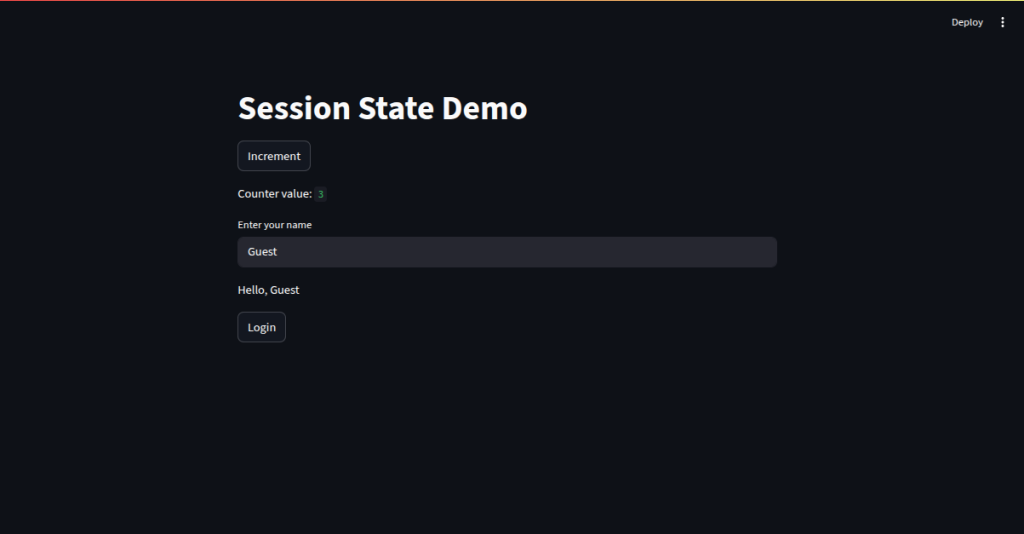
Normally, Streamlit re-runs the entire script from top to bottom whenever a widget changes, which means variables reset unless we explicitly store them. The st.session_state API lets us persist values across reruns, enabling counters, user profiles, and login states without external databases.
Persisting a Counter
We check if"counter"exists inst.session_state. If not, we initialize it to0. Each click of the Increment button increases its value, and it stays updated between reruns.Storing User Inputs
We set a default"name"value if not already present, then update it whenever the user types in the text box. This ensures that even if the app refreshes, the name remains filled in.Conditional Display Based on State
We maintain a"logged_in"flag to track authentication. If the user is not logged in, a Login button updates the state and shows a success message. If logged in, we greet them and show a Logout button to reset the state.
This approach transforms Streamlit apps from static pages into stateful, interactive applications that remember users’ actions during their session.
					# ------ Using session state to store user interactions ------
import streamlit as st

st.title("Session State Demo")

# Initialize a counter if it doesn't exist
if "counter" not in st.session_state:
    st.session_state.counter = 0

if st.button("Increment"):
    st.session_state.counter += 1

st.write("Counter value:", st.session_state.counter)

# Save and refresh.
# ------ streamlit run


# ------ Initializing, updating, and persisting session data ------
# Default values for multiple keys
if "name" not in st.session_state:
    st.session_state.name = "Guest"

name_input = st.text_input("Enter your name", st.session_state.name)
if name_input != st.session_state.name:
    st.session_state.name = name_input

st.write("Hello,", st.session_state.name)

# Save and refresh.
# ------ streamlit run


# ------ Conditional display based on user state ------
if "logged_in" not in st.session_state:
    st.session_state.logged_in = False

if not st.session_state.logged_in:
    if st.button("Login"):
        st.session_state.logged_in = True
        st.success("You are now logged in!")
else:
    st.write("Welcome back!")
    if st.button("Logout"):
        st.session_state.logged_in = False

# Save and refresh.
# ------ streamlit run
2-2
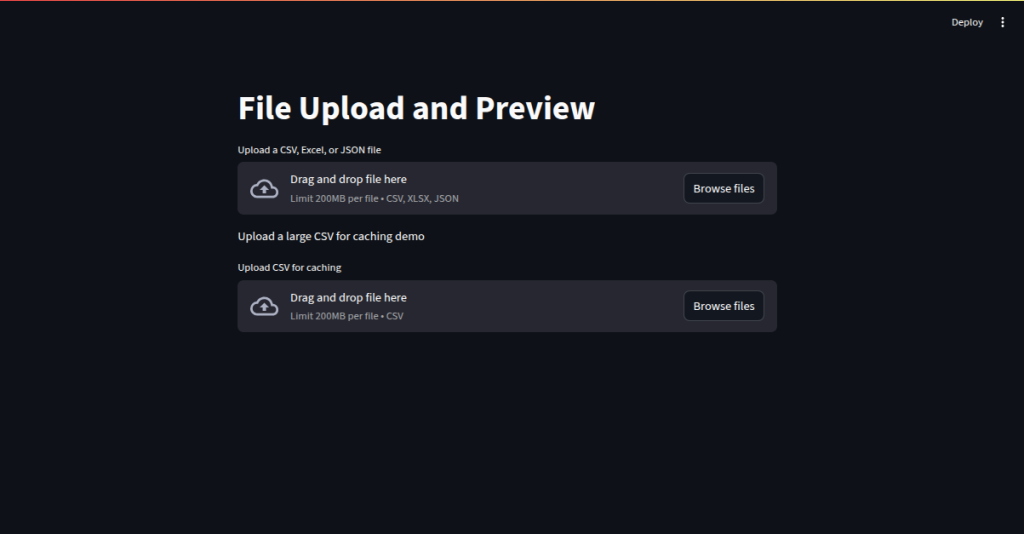
In real-world apps, we often need to let users upload files—whether it’s a CSV, Excel spreadsheet, or JSON document—and display a quick preview. Streamlit’s st.file_uploader() makes this effortless.
Uploading and Detecting File Types
We allow multiple formats (.csv,.xlsx,.json) and detect the file type from its extension.For CSV: we read it using
pd.read_csv()and display the first few rows in an interactive table.For Excel: we use
pd.read_excel()for the same preview experience.For JSON: we parse with Python’s
json.load()and display it neatly usingst.json().
Validating Files Before Processing
We extract file name and size usinguploaded_file.nameanduploaded_file.size. If the file exceeds 500 KB, we warn the user to expect a limited preview. This helps avoid slow rendering for large datasets.Boosting Performance with Caching
When handling large datasets, repeatedly reloading them on every widget interaction is inefficient. By decorating a loader function with@st.cache_data, Streamlit stores the processed DataFrame in memory. This way, the file is only read once unless it changes, significantly speeding up the app.
					# ------ Reading CSV, Excel, and JSON files ------
import streamlit as st
import pandas as pd
import json

st.title("File Upload and Preview")

uploaded_file = st.file_uploader("Upload a CSV, Excel, or JSON file", type=["csv", "xlsx", "json"])

if uploaded_file:
    if uploaded_file.name.endswith(".csv"):
        df = pd.read_csv(uploaded_file)
        st.write("CSV Preview:")
        st.dataframe(df.head())

    elif uploaded_file.name.endswith(".xlsx"):
        df = pd.read_excel(uploaded_file)
        st.write("Excel Preview:")
        st.dataframe(df.head())

    elif uploaded_file.name.endswith(".json"):
        data = json.load(uploaded_file)
        st.write("JSON Preview:")
        st.json(data)

# Save and refresh.
# ------ streamlit run


# ------ Validating uploaded files and showing previews ------
if uploaded_file:
    file_size = uploaded_file.size / 1024  # size in KB
    st.write(f"File name: {uploaded_file.name}, Size: {file_size:.2f} KB")
    if file_size > 500:
        st.warning("File is large! Preview may be limited.")

# Save and refresh.
# ------ streamlit run


# ------ Caching data and resources for performance ------
@st.cache_data
def load_large_csv(file):
    return pd.read_csv(file)

st.write("Upload a large CSV for caching demo")
large_csv = st.file_uploader("Upload CSV for caching", type=["csv"], key="large")

if large_csv:
    df_large = load_large_csv(large_csv)
    st.write("Cached CSV Loaded:")
    st.dataframe(df_large.head())

# Save and refresh.
# ------ streamlit run
2-3
					# ------ Using built-in charting options: line, bar, area charts ------
import streamlit as st
import pandas as pd
import numpy as np

st.title("Built-in Charts")

data = pd.DataFrame(np.random.randn(20, 3), columns=['A', 'B', 'C'])

st.subheader("Line Chart")
st.line_chart(data)

st.subheader("Area Chart")
st.area_chart(data)

st.subheader("Bar Chart")
st.bar_chart(data)

# Save and refresh.
# ------ streamlit run


# ------ Creating visualizations with Plotly ------
import plotly.express as px

st.subheader("Plotly Example")
fig = px.scatter(data, x='A', y='B', color='C', title="Plotly Scatter")
st.plotly_chart(fig)

# Save and refresh.
# ------ streamlit run


# ------ Creating visualizations with Altair ------
import altair as alt

st.subheader("Altair Example")
chart = alt.Chart(data).mark_line().encode(
    x='A',
    y='B',
    color='C'
)
st.altair_chart(chart, use_container_width=True)

# Save and refresh.
# ------ streamlit run


# ------ Creating visualizations with Seaborn and Matplotlib ------
import matplotlib.pyplot as plt
import seaborn as sns

st.subheader("Seaborn Example")
fig, ax = plt.subplots()
sns.histplot(data['A'], kde=True, ax=ax)
st.pyplot(fig)

# Save and refresh.
# ------ streamlit run


# ------ Adding interactivity and themes to charts ------
# Example: Theme toggle with a checkbox
st.subheader("Interactive Theme Example")
dark_mode = st.checkbox("Enable Dark Theme")

fig = px.line(data, x=data.index, y='A', title="Interactive Line Chart")
if dark_mode:
    fig.update_layout(template="plotly_dark")

st.plotly_chart(fig)

# Save and refresh.
# ------ streamlit run
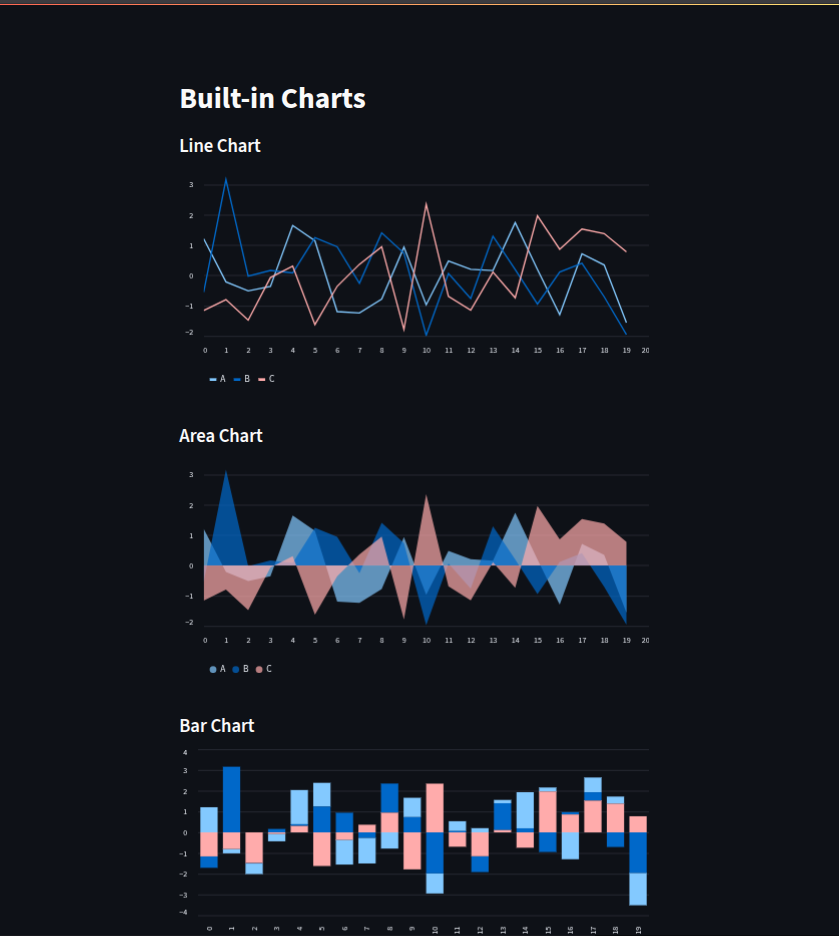
Streamlit provides multiple ways to create and display charts—ranging from simple built-in plots to fully customizable visualizations with popular libraries.
Built-in Chart Functions
With just one line of code, we can generate a line chart, area chart, or bar chart usingst.line_chart(),st.area_chart(), andst.bar_chart(). These are perfect for quick data exploration.Interactive Charts with Plotly
Using Plotly Express, we can build interactive scatter plots, line charts, and more. We pass our DataFrame intopx.scatter()and then render it withst.plotly_chart(). This allows zooming, hovering, and panning.Declarative Charts with Altair
Altair offers a clean syntax for defining charts. For example,alt.Chart(data).mark_line().encode(...)creates a line plot with encoding rules for axes and colors. Streamlit integrates this directly viast.altair_chart().Statistical Plots with Seaborn & Matplotlib
For more control and statistical visualization, we can use Seaborn inside a Matplotlib figure, then display it withst.pyplot(). This is great for histograms, KDE plots, and advanced analytics visuals.Interactive Themes and User Controls
We can enhance charts with user-driven interactivity—like a Dark Mode toggle that switches the Plotly theme by updatingfig.update_layout(template="plotly_dark")
2-4
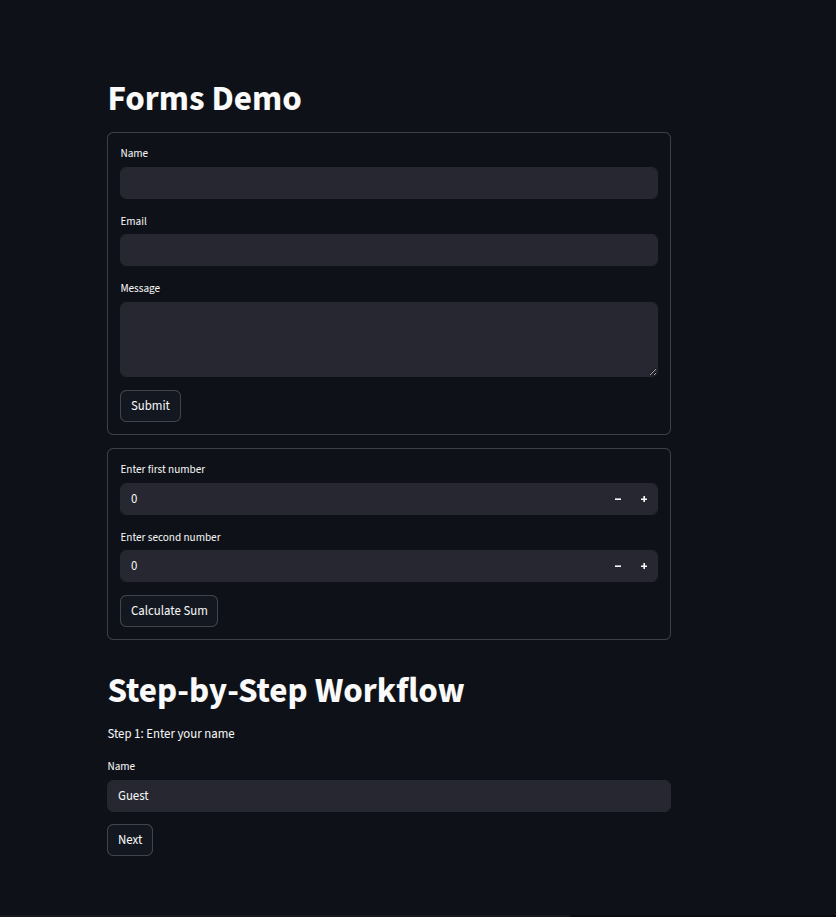
Streamlit allows us to group related input widgets into forms, making it easier to organize user interactions and control when data is submitted.
Forms for Structured Input
Usingst.form(), we can group multiple input widgets—like text fields and text areas—into a single block with its own submit button. This ensures that the form’s values are only processed when the user explicitly clicks submit. For example, a Contact Form collects a name, email, and message before showing a success message upon submission.Form Submit Buttons with Logic
We can pair a form’s submit button with processing logic. In a calculation form, two numeric inputs are added together only after the user clicks Calculate Sum, ensuring precise control over when the computation happens.Step-by-Step Workflows
For multi-stage interactions, we can store progress inst.session_stateand control the flow through steps. In the example workflow:Step 1: The user enters their name.
Step 2: They choose an option from a radio button list.
Step 3: The app shows their selection and offers a restart option.
By defining helper functions like
next_step()andrestart(), we can easily manage transitions and resets, creating a smooth guided experience for users.
					# ------ Grouping widgets into forms ------
import streamlit as st

st.title("Forms Demo")

with st.form("contact_form"):
    name = st.text_input("Name")
    email = st.text_input("Email")
    message = st.text_area("Message")
    submitted = st.form_submit_button("Submit")

if submitted:
    st.success(f"Thanks {name}, we'll contact you at {email}!")

# Save and refresh.
# ------ streamlit run


# ------ Using form submit buttons with logic ------
with st.form("calc_form"):
    num1 = st.number_input("Enter first number", step=1)
    num2 = st.number_input("Enter second number", step=1)
    calculate = st.form_submit_button("Calculate Sum")

if calculate:
    st.write(f"Result: {num1 + num2}")

# Save and refresh.
# ------ streamlit run


# ------ Creating step-by-step workflows ------

st.title("Step-by-Step Workflow")

# Initialize state
if "step" not in st.session_state:
    st.session_state.step = 1
if "name" not in st.session_state:
    st.session_state.name = ""
if "choice" not in st.session_state:
    st.session_state.choice = ""

# Step transition functions
def next_step():
    st.session_state.step += 1

def restart():
    st.session_state.step = 1
    st.session_state.name = ""
    st.session_state.choice = ""

# Step 1
if st.session_state.step == 1:
    st.write("Step 1: Enter your name")
    st.text_input("Name", value=st.session_state.name, key="name")
    st.button("Next", on_click=next_step)

# Step 2
elif st.session_state.step == 2:
    st.write(f"Hello {st.session_state.name}, Step 2: Choose your preference")
    st.radio("Choose your favorite fast casual spot:", ["Chipotle", "Moe's"], key="choice")
    st.button("Next", on_click=next_step)

# Step 3
elif st.session_state.step == 3:
    st.write(f"Final Step: You selected {st.session_state.choice}")
    st.button("Restart", on_click=restart)

# Save and refresh.
# ------ streamlit run
2-5
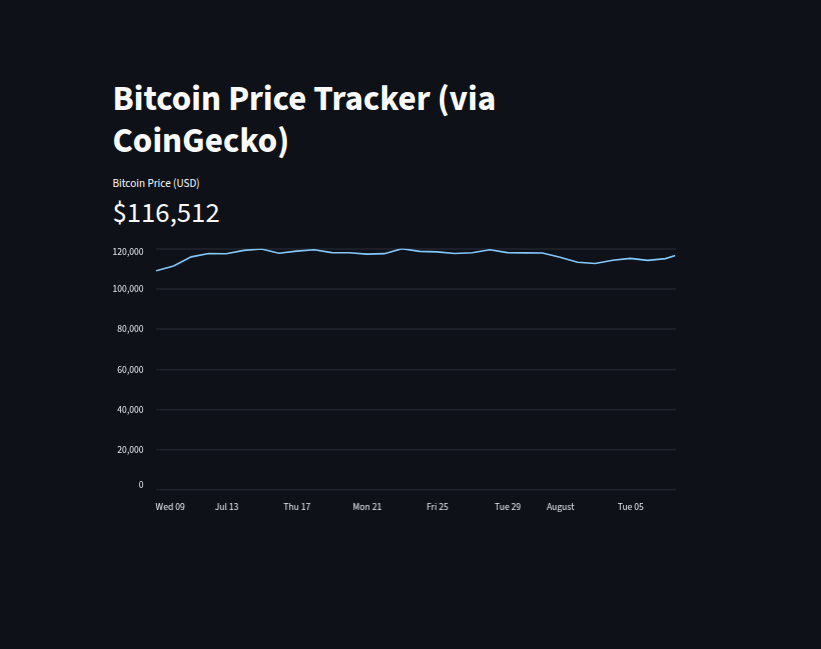
We created a Bitcoin Price Tracker using Streamlit and CoinGecko’s public API to display both the current Bitcoin price and its historical trend over the past 30 days.
Fetching Current Price
We use thesimple/priceendpoint from CoinGecko to retrieve Bitcoin’s value in USD. Therequestslibrary handles the API call, with a timeout for reliability. The fetched price is displayed usingst.metric()for a clean, dashboard-like presentation.Retrieving Historical Data
For the price history, we query themarket_chartendpoint with parameters specifying the currency (usd), time range (30 days), and granularity (daily). The JSON response contains timestamp–price pairs, which we load into a Pandas DataFrame.Data Processing and Visualization
We convert UNIX timestamps to human-readable dates usingpd.to_datetime(), then visualize the trend usingst.line_chart()for a quick, interactive view of price fluctuations.Error Handling
Both API calls are wrapped intry–exceptblocks to gracefully handle connection issues, invalid responses, or server errors, ensuring the app remains user-friendly even during failures.
This compact yet powerful app demonstrates how Streamlit, combined with external APIs, can deliver real-time financial dashboards with just a few lines of Python.
					import streamlit as st
import requests
import pandas as pd

st.title("Bitcoin Price Tracker (via CoinGecko)")

# --------- Current Price ---------
price_url = "https://api.coingecko.com/api/v3/simple/price?ids=bitcoin&vs_currencies=usd"

try:
    price_response = requests.get(price_url, timeout=10)
    price_response.raise_for_status()
    price = price_response.json()["bitcoin"]["usd"]
    st.metric(label="Bitcoin Price (USD)", value=f"${price:,}")
except requests.exceptions.RequestException as e:
    st.error(f"Failed to fetch current price: {e}")

# --------- Historical Data ---------
history_url = "https://api.coingecko.com/api/v3/coins/bitcoin/market_chart"
params = {"vs_currency": "usd", "days": "30", "interval": "daily"}

try:
    history_response = requests.get(history_url, params=params, timeout=10)
    history_response.raise_for_status()
    prices = history_response.json()["prices"]

    df = pd.DataFrame(prices, columns=["Timestamp", "Price"])
    df["Date"] = pd.to_datetime(df["Timestamp"], unit='ms')
    st.line_chart(df.set_index("Date")["Price"])

except requests.exceptions.RequestException as e:
    st.error(f"Failed to fetch historical data: {e}")
2-6-1
					[theme]
base = "dark"
primaryColor = "#FF5722"
backgroundColor = "#1E1E1E"
secondaryBackgroundColor = "#2C2C2C"
textColor = "#FAFAFA"
font = "monospace"
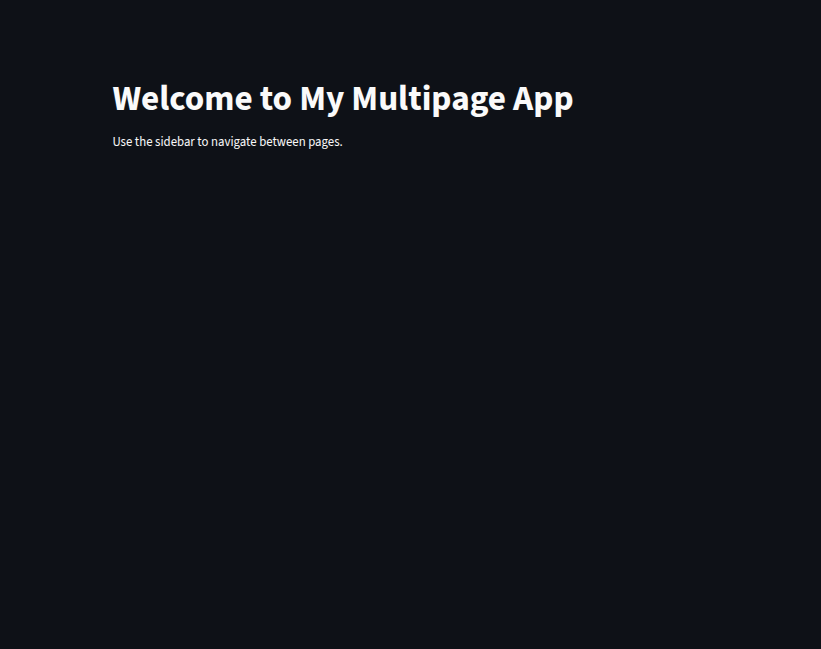
We can create multipage Streamlit apps by structuring our project into a main script and dedicated pages/ directory. In this setup, our root folder contains Home.py for the main landing page, a pages/ folder for additional screens like 1_About.py and 2_Contact.py, and a .streamlit/config.toml file to define the app’s theme.
Main Entry Point (
Home.py)
This file acts as the starting page, setting the title and basic instructions. Streamlit automatically detects other.pyfiles in thepages/folder and adds them to the sidebar navigation.Page Organization
Files inside thepages/directory can be ordered using a numeric prefix (e.g.,1_About.pyappears before2_Contact.py). Each file functions independently as a standard Streamlit script.Theming with
config.toml
By adding a.streamlit/config.tomlfile, we control app-wide styles like base theme (lightordark), primary colors, and fonts—giving a polished, branded look without changing the Python code.
					# ------ Creating multipage apps using folders and config files ------
# Project structure:
# my_app/
# ├── Home.py
# ├── pages/
# │   ├── 1_About.py
# │   ├── 2_Contact.py
# └── .streamlit/
#     └── config.toml

# Example Home.py content:
import streamlit as st

st.title("Welcome to My Multipage App")
st.write("Use the sidebar to navigate between pages.")

# ------ streamlit run Home.py

# config.toml example (inside .streamlit folder):
# [theme]
# base="light"
# primaryColor="#4CAF50"
# font="sans serif"
2-6-2
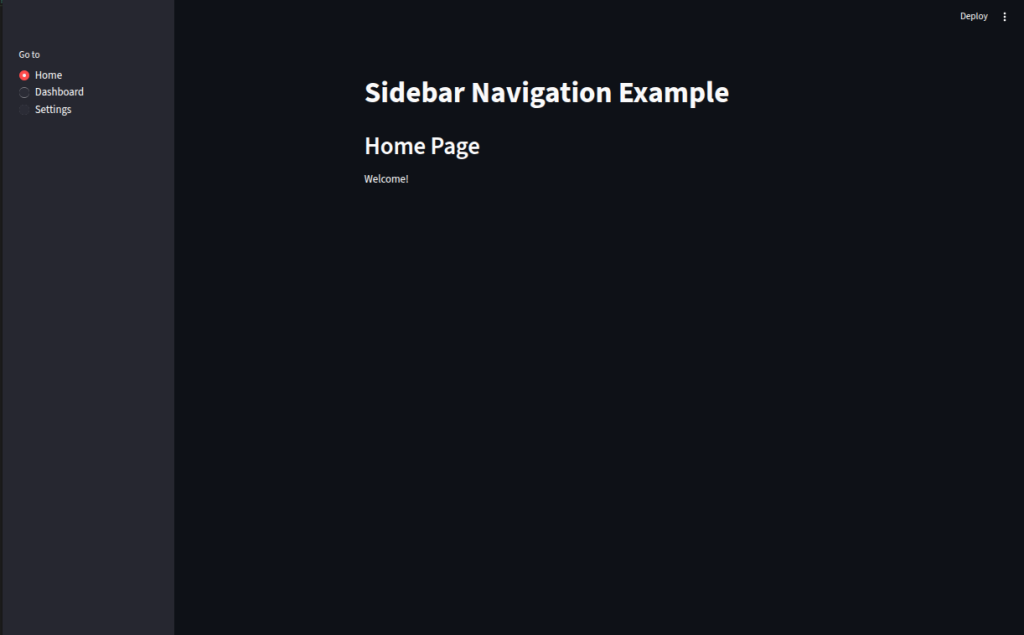
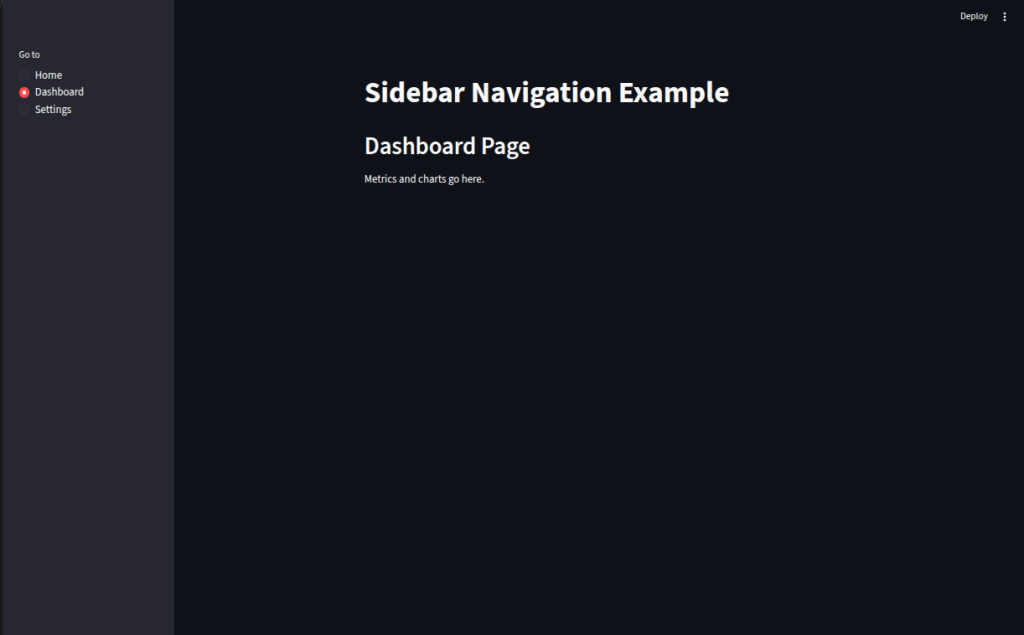
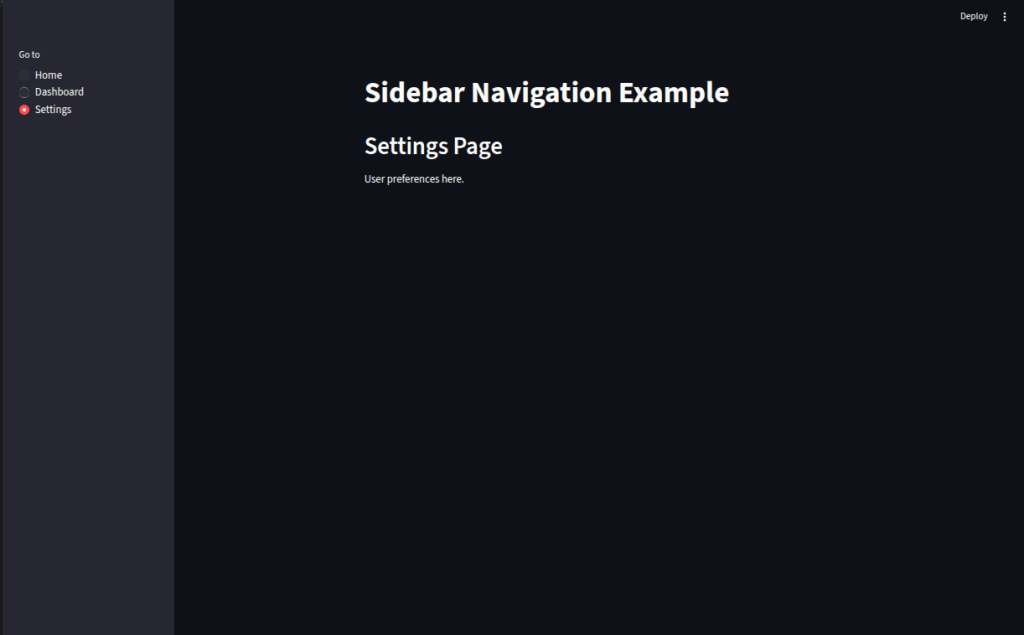
This code is a simple single-file navigation system in Streamlit using the sidebar.
How it works
Title and Page List
st.title("Sidebar Navigation Example")sets the main page heading.pages = ["Home", "Dashboard", "Settings"]defines available sections.
Sidebar Menu
st.sidebar.radio("Go to", pages)creates a radio button menu in the sidebar where the user selects a page.
Conditional Page Display
Based on the selected value in
choice, Streamlit runs the corresponding block of code (if choice == "Home": ...).
Why use this?
Great for small apps where you don’t need a full multipage setup with a
pages/folder.Keeps everything in one file, but still allows clear page separation.
					# ------ Sidebar or header-based navigation ------
import streamlit as st

st.title("Sidebar Navigation Example")

pages = ["Home", "Dashboard", "Settings"]
choice = st.sidebar.radio("Go to", pages)

if choice == "Home":
    st.header("Home Page")
    st.write("Welcome!")
elif choice == "Dashboard":
    st.header("Dashboard Page")
    st.write("Metrics and charts go here.")
elif choice == "Settings":
    st.header("Settings Page")
    st.write("User preferences here.")

# ------ streamlit run
2-6-3
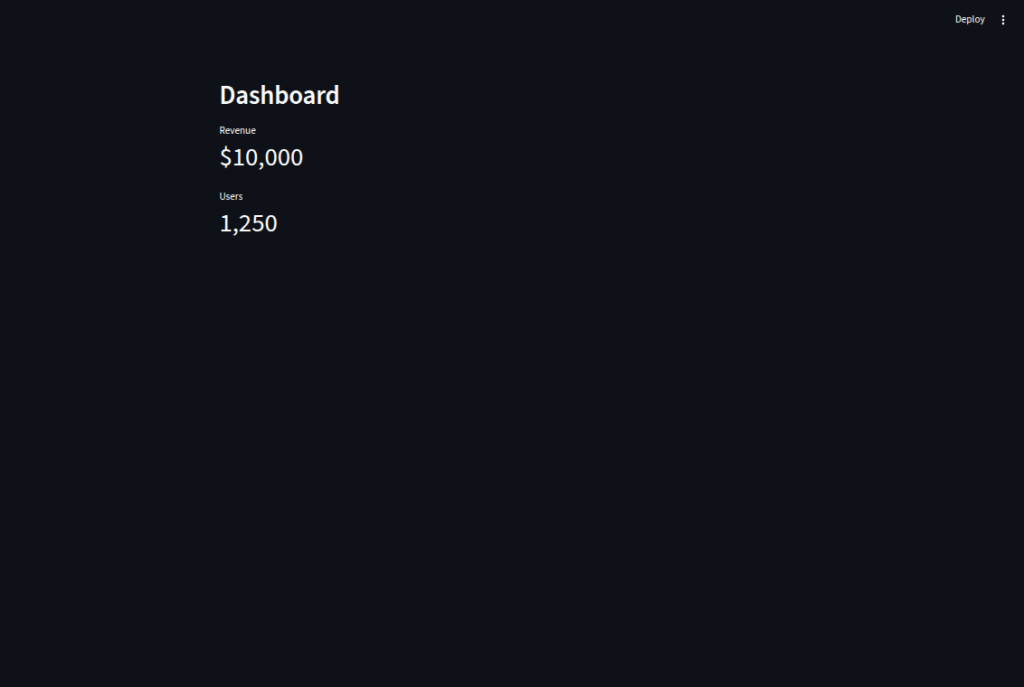
This code shows how we can make our Streamlit apps more organized by creating reusable UI components.
We define
show_header(title)so we can display section headers with a consistent style everywhere.We create
show_metric(label, value)so we can present KPIs in the same format without rewriting code.By calling these functions (
show_header("Dashboard"),show_metric(...)), we keep our main app short, readable, and easy to maintain.In bigger projects, we can place these helper functions in a separate file like
components.pyso we can reuse them across multiple pages and keep the design consistent.
					import streamlit as st

# ------ Organizing large apps with reusable components ------
# Example of using functions for reusable UI components
def show_header(title):
    st.markdown(f"## {title}")

def show_metric(label, value):
    st.metric(label=label, value=value)

# Using the reusable functions
show_header("Dashboard")
show_metric("Revenue", "$10,000")
show_metric("Users", "1,250")

# ------ streamlit run
2-7
We create a
.streamlit/config.tomlfile to define theme colors, fonts, and server behavior so the style is consistent every time the app runs.We use
[theme]settings for branding (likeprimaryColor,backgroundColor, andfont) and[server]for app behavior (runOnSavefor auto-refresh).We call
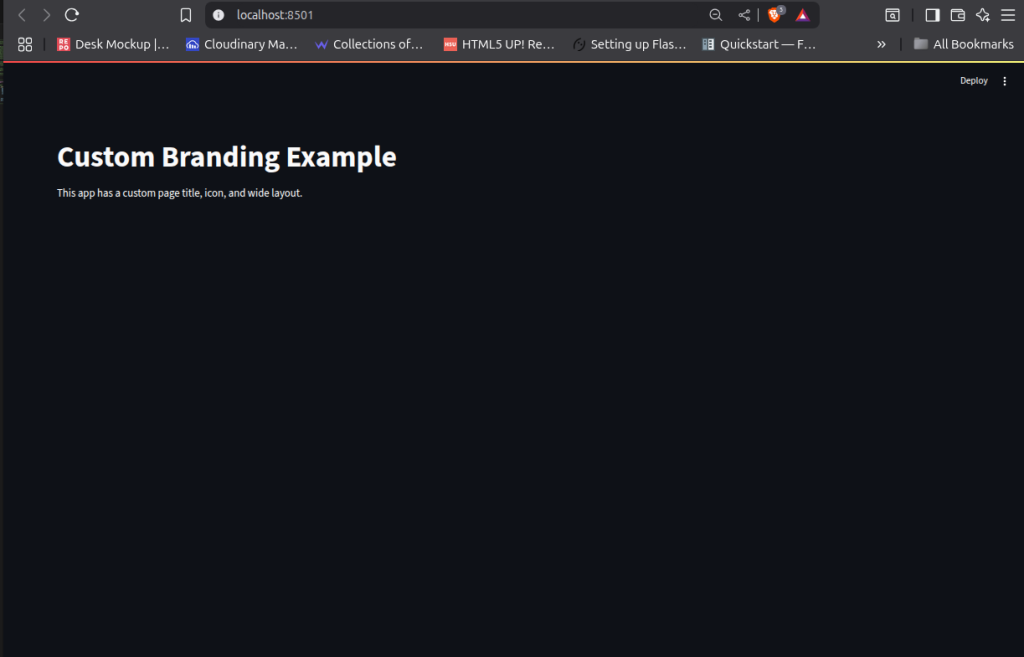
st.set_page_config()at the start of our script to set the page title, favicon icon, layout (wide or centered), and sidebar state.With this setup, we make the app look cleaner, match it to company colors, and improve the overall user experience without writing extra CSS.
					# ------ Setting up config files for layout and branding ------
# Create a folder: .streamlit/
# Inside it, create config.toml file:
#
# Example config.toml:
# [theme]
# base="light"
# primaryColor="#4CAF50"
# backgroundColor="#FFFFFF"
# secondaryBackgroundColor="#F0F0F0"
# textColor="#000000"
# font="sans serif"
#
# [server]
# headless = true
# runOnSave = true
#
# [browser]
# gatherUsageStats = false

# Save and restart Streamlit to apply config.
# ------ streamlit run


# ------ Adding custom titles, icons, and styles ------
import streamlit as st

# Set page title, icon, layout
st.set_page_config(
    page_title="My Custom App",
    page_icon="📊",
    layout="wide",  # Options: "centered", "wide"
    initial_sidebar_state="expanded"
)

st.title("Custom Branding Example")
st.write("This app has a custom page title, icon, and wide layout.")

# ------ streamlit run
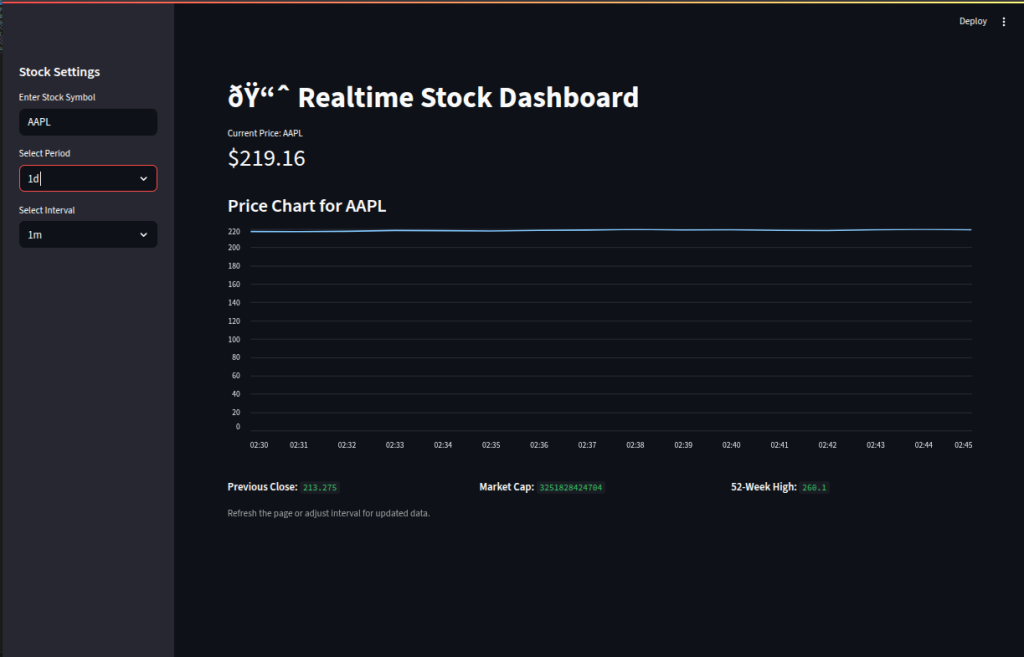
2 - Project 1
Here, we build a real-time stock dashboard using the yfinance API to track and visualize market data:
We set a wide layout and custom page title/icon with
st.set_page_config()for a polished dashboard look.We add a sidebar so users can input a stock ticker, select a time period, and choose an update interval.
We fetch historical and current price data using
yf.Ticker().history()and display the latest price withst.metric().We visualize price trends using
st.line_chart()for quick market insight.We enhance the dashboard by showing extra stock details like previous close, market cap, and 52-week high in columns.
We provide a refresh note so users know how to update data without manual code changes.
					# ------ Realtime Dashboard with yfinance API ------
import streamlit as st
import yfinance as yf
import pandas as pd
from datetime import date

st.set_page_config(page_title="Stock Dashboard", page_icon="📈", layout="wide")

st.title("📈 Realtime Stock Dashboard")

# Sidebar for user input
st.sidebar.header("Stock Settings")
ticker_symbol = st.sidebar.text_input("Enter Stock Symbol", "AAPL")  # Default: Apple
period = st.sidebar.selectbox("Select Period", ["1d", "5d", "1mo", "6mo", "1y", "5y"])
interval = st.sidebar.selectbox("Select Interval", ["1m", "5m", "15m", "1h", "1d"])

# Fetch data
ticker = yf.Ticker(ticker_symbol)
data = ticker.history(period=period, interval=interval)

# Show latest price
latest_price = data["Close"].iloc[-1] if not data.empty else "N/A"
st.metric(label=f"Current Price: {ticker_symbol}", value=f"${latest_price:.2f}" if latest_price != "N/A" else "No Data")

# Chart section
st.subheader(f"Price Chart for {ticker_symbol}")
if not data.empty:
    st.line_chart(data["Close"])
else:
    st.warning("No data available for this symbol.")

# Add additional info in columns
col1, col2, col3 = st.columns(3)
with col1:
    st.write("**Previous Close:**", ticker.info.get("previousClose", "N/A"))
with col2:
    st.write("**Market Cap:**", ticker.info.get("marketCap", "N/A"))
with col3:
    st.write("**52-Week High:**", ticker.info.get("fiftyTwoWeekHigh", "N/A"))

# Refresh notice
st.caption("Refresh the page or adjust interval for updated data.")

# ------ streamlit run
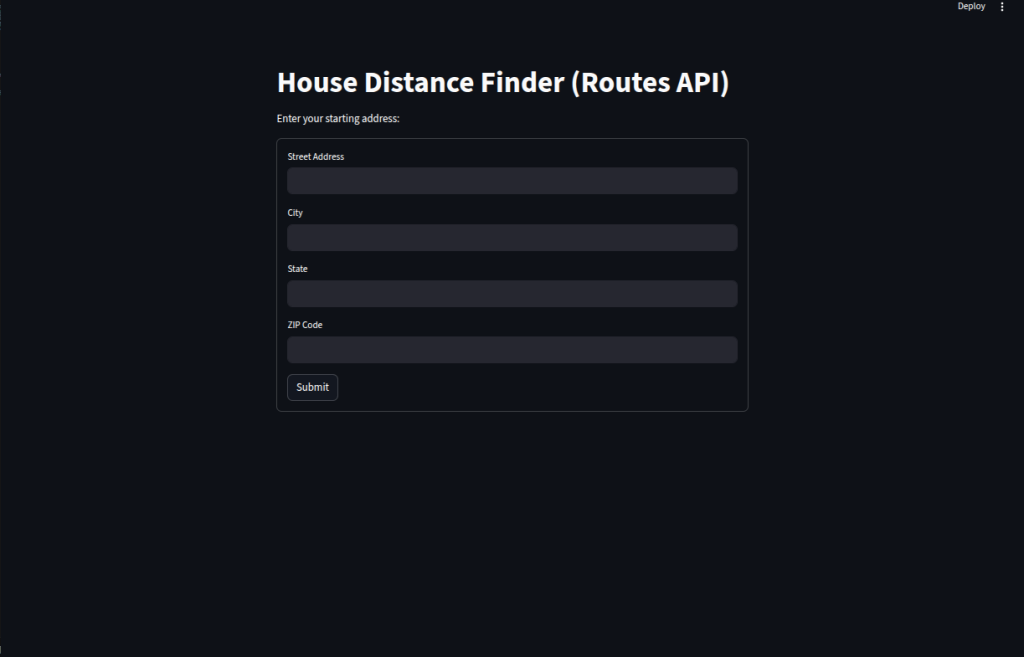
2 - Project 2
Here, we create a House Distance Finder app in Streamlit that uses the Google Routes API to calculate driving distances from a user’s address to various Denver locations:
We define a list of popular destinations, each with a name and full address.
We build an input form so users can enter their street, city, state, and ZIP code, then submit it to start calculations.
We create a helper function
get_distance_miles()that sends a POST request to the Google Routes API, retrieves the driving distance in meters, and converts it to miles.We loop through the list of locations, calculate distances from the user’s address, and store the results in a list of dictionaries.
We load the results into a pandas DataFrame, sort them by distance, and display them in a neat, interactive table in Streamlit.
					import pandas as pd
import streamlit as st
import googlemaps
import requests


API_KEY = ""


denver_locations = [
    {'location': 'Pikes Peak', 'Address': '515 Ruxton Ave, Manitou Springs, CO 80829'},
    {'location': 'Magnolia Road', 'Address': '45 Peak to Peak Hwy, Nederland, CO 80466'},

    {'location': 'Coors Field', 'Address': '2001 Blake Street, Denver, CO 80205'},
    {'location': 'Denver Card Show', 'Address': '5004 National Western Dr, Denver, CO 80216'},


    {'location': 'Fillmore Auditorium', 'Address': '2001 Blake Street, Denver, CO 80205'},
    {'location': 'Mission Ballroom', 'Address': '4242 Wynkoop St, Denver, CO 80216'},
    {'location': 'Red Rock Ampitheater', 'Address': '18300 W Alameda Pkwy, Morrison, CO 80465'},


]

st.title("House Distance Finder (Routes API)")
st.write("Enter your starting address:")

with st.form("address_form"):
    street = st.text_input("Street Address")
    city = st.text_input("City")
    state = st.text_input("State")
    zip_code = st.text_input("ZIP Code")
    submitted = st.form_submit_button("Submit")

if submitted:
    user_address = f"{street}, {city}, {state} {zip_code}"
    st.success(f"Calculating distances from: {user_address}")

    def get_distance_miles(origin, destination):
        url = f"https://routes.googleapis.com/directions/v2:computeRoutes?key={API_KEY}"

        headers = {
            "Content-Type": "application/json",
            "X-Goog-FieldMask": "routes.distanceMeters"
        }

        body = {
            "origin": {"address": origin},
            "destination": {"address": destination},
            "travelMode": "DRIVE"
        }

        try:
            response = requests.post(url, headers=headers, json=body)
            response.raise_for_status()
            data = response.json()

            meters = data["routes"][0]["distanceMeters"]
            miles = round(meters / 1609.34, 2)
            return miles
        except Exception as e:
            st.warning(f"Error for {destination}: {e}")
            return None

    # Collect results
    results = []
    for loc in nemours_locations:
        miles = get_distance_miles(user_address, loc["Address"])
        results.append({
            "location": loc["location"],
            "Address": loc["Address"],
            "Distance (mi)": miles
        })

    # Create and display DataFrame
    df = pd.DataFrame(results).set_index("location")
    df2 = df.sort_values('Distance (mi)')
    st.dataframe(df2)
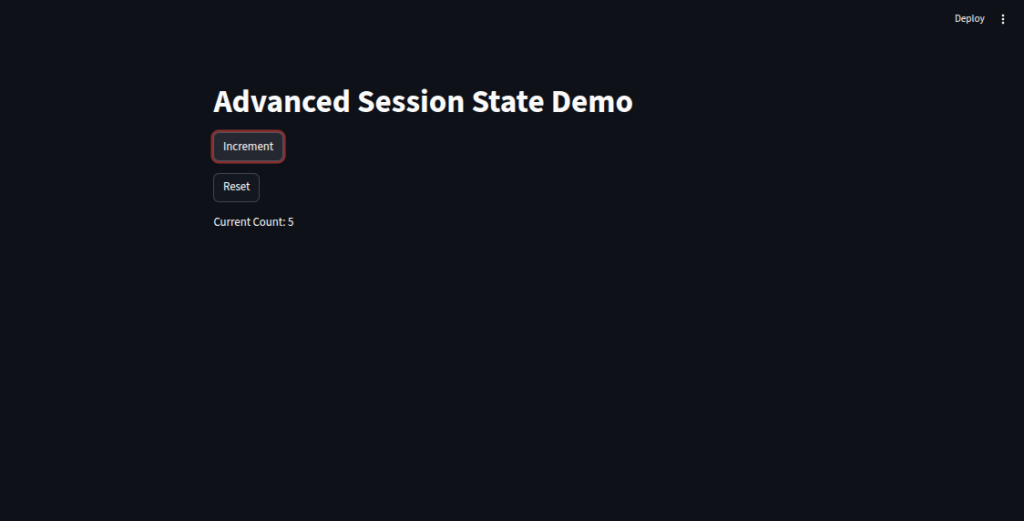
3-1
Here, we demonstrate advanced session state usage in Streamlit by persisting and controlling variables across user interactions:
We initialize a
countvariable inst.session_stateonly if it doesn’t already exist, ensuring it survives reruns.We provide two buttons—one to increment the counter and another to reset it to zero—showing how session state can be updated interactively.
We display the current count so users can track changes in real time.
					# ------ Advanced usage of session state ------
import streamlit as st

st.title("Advanced Session State Demo")

# Initialize state variables
if "count" not in st.session_state:
    st.session_state.count = 0

# Buttons to modify session state
if st.button("Increment"):
    st.session_state.count += 1
if st.button("Reset"):
    st.session_state.count = 0

st.write(f"Current Count: {st.session_state.count}")

# ------ streamlit run
3-2
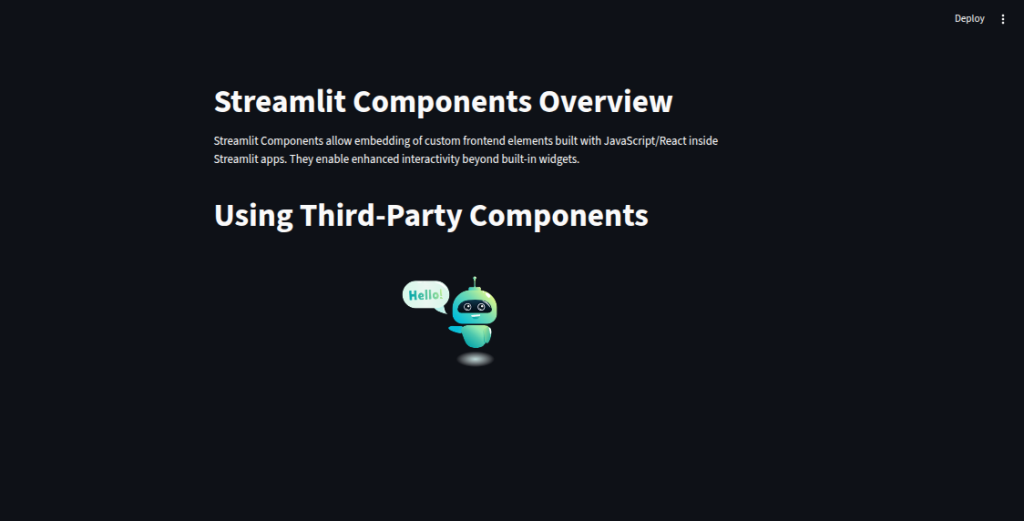
We introduce the Streamlit Components system, which lets us embed custom frontend elements built with JavaScript or React into our Streamlit apps for richer interactivity.
We show how to use community-built components, like
streamlit-lottie, to add animations by fetching and rendering Lottie JSON files.We outline the process for creating custom components, starting from the Streamlit Component Template, building the frontend with Node.js, and integrating it back into Python for interactive widgets.
We emphasize that components expand beyond built-in widgets, enabling unique, highly interactive features tailored to our app’s needs.
					# ------ Overview of Streamlit Components system ------
import streamlit as st

st.title("Streamlit Components Overview")

st.write("""
Streamlit Components allow embedding of custom frontend elements
built with JavaScript/React inside Streamlit apps.
They enable enhanced interactivity beyond built-in widgets.
""")

# ------ streamlit run

# ------ Using third-party components from the community ------
import streamlit as st
from streamlit_lottie import st_lottie
import requests

st.title("Using Third-Party Components")

# Example: Display animated Lottie JSON animation
def load_lottieurl(url):
    r = requests.get(url)
    if r.status_code == 200:
        return r.json()
    return None

lottie_url = "https://assets10.lottiefiles.com/packages/lf20_1pxqjqps.json"
lottie_json = load_lottieurl(lottie_url)
st_lottie(lottie_json, height=200)

# ------ streamlit run


# ------ Creating a custom component with JavaScript or React ------
# Note: This requires Node.js and streamlit-component-template setup
#
# Steps:
# 1. Use Streamlit Component Template (https://github.com/streamlit/component-template)
# 2. Build your React/JS component inside the frontend folder
# 3. Use `streamlit run` for Python and `npm start` for frontend during dev
# 4. Import your component in Python and use it like a widget
#
# Minimal example usage:
# import my_component
# val = my_component.my_widget(label="Custom input")
# st.write(f"Value from component: {val}")
#
# we can say ssee Streamlit docs for detailed guide.

# ------ streamlit run
3-3-1
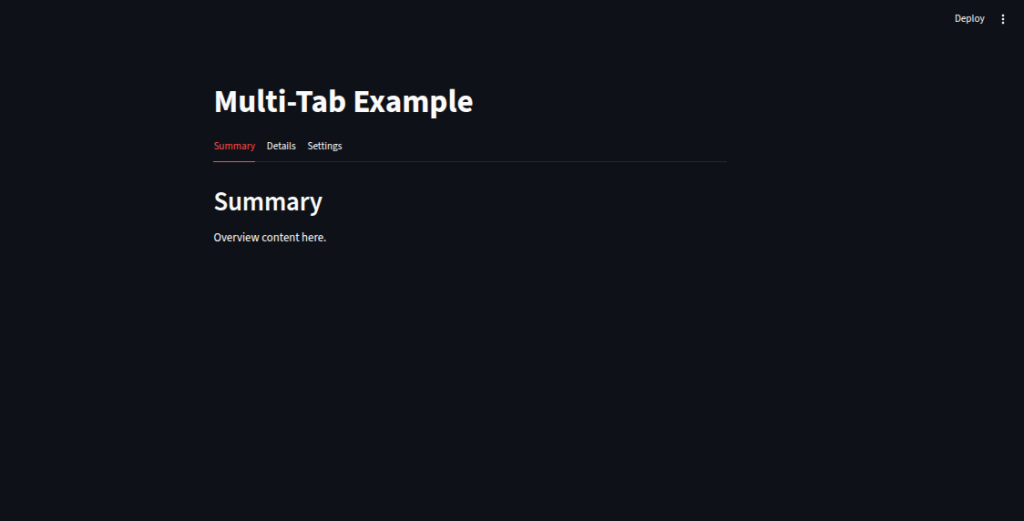
We use
st.tabs()to create separate sections (“Summary”, “Details”, “Settings”) within the same page, allowing users to switch views without navigating away.We place each tab’s content inside a
with tabs[i]:block so that its header and content are displayed only when that tab is active.We organize related information neatly — for example, summaries, in-depth details, and user settings — improving the app’s clarity and usability.
We keep the user experience smooth by avoiding page reloads, letting them explore multiple sections quickly.
					# ------ Multi-tab or segmented views ------
import streamlit as st

st.title("Multi-Tab Example")

tabs = st.tabs(["Summary", "Details", "Settings"])

with tabs[0]:
    st.header("Summary")
    st.write("Overview content here.")

with tabs[1]:
    st.header("Details")
    st.write("Detailed info goes here.")

with tabs[2]:
    st.header("Settings")
    st.write("User preferences here.")

# ------ streamlit run
3-3-2
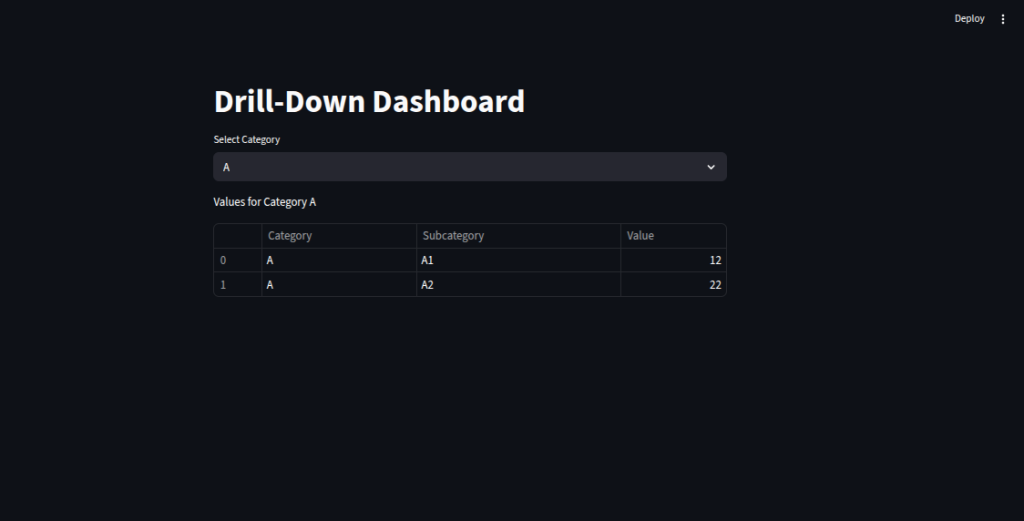
We load a sample dataset with categories, subcategories, and values to simulate dashboard data.
We use
st.selectbox()to let users choose a category, acting as a filter control.We filter the DataFrame based on the selected category, giving users a focused view of relevant data.
We display the filtered results in a clean table format, allowing quick drill-down into specific sections.
We create an interactive, user-driven experience where insights can be explored step-by-step.
					# ------ Drill-down and filterable dashboards ------
import streamlit as st
import pandas as pd
import numpy as np

st.title("Drill-Down Dashboard")

data = pd.DataFrame({
    "Category": ["A", "A", "B", "B", "C", "C"],
    "Subcategory": ["A1", "A2", "B1", "B2", "C1", "C2"],
    "Value": np.random.randint(10, 100, 6)
})

category = st.selectbox("Select Category", data["Category"].unique())

filtered = data[data["Category"] == category]

st.write(f"Values for Category {category}")
st.table(filtered)

# ------ streamlit run
3-3-3
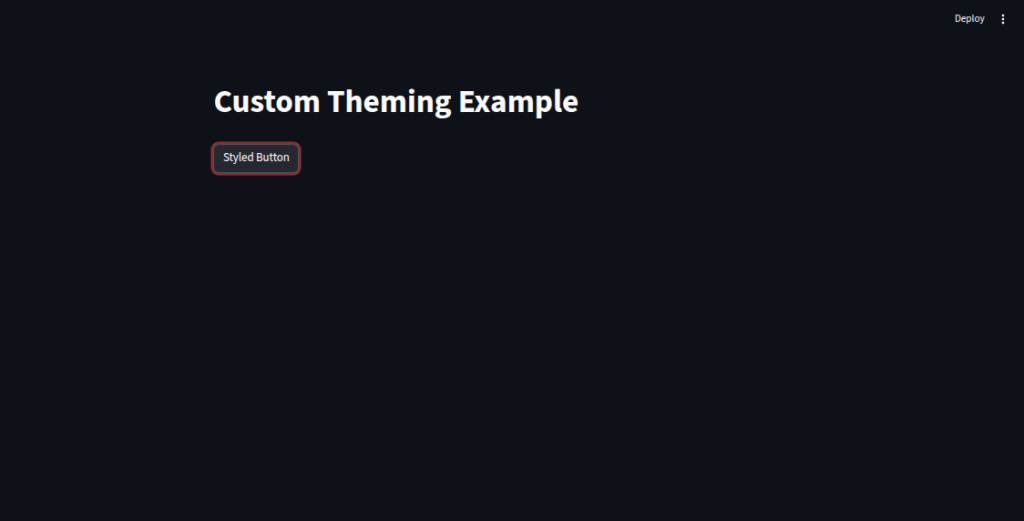
We enhance the app’s look and feel by embedding custom CSS directly using
st.markdown()withunsafe_allow_html=True.We change the background color by targeting Streamlit’s internal container class.
We style the button with a green background and white text for brand consistency.
We can maintain a cohesive design across the app by combining inline CSS with the
.streamlit/config.tomlglobal theme settings.We use this approach to align the app’s visuals with our brand identity and create a professional appearance.
					# ------ Theming, CSS customization, and brand consistency ------
import streamlit as st

st.title("Custom Theming Example")

st.markdown(
    """
    <style>
    .css-1aumxhk {
        background-color: #f0f8ff;
    }
    .stButton>button {
        background-color: #4CAF50;
        color: white;
    }
    </style>
    """,
    unsafe_allow_html=True
)

st.button("Styled Button")

# Use .streamlit/config.toml for global themes

# ------ streamlit run
3-4-1
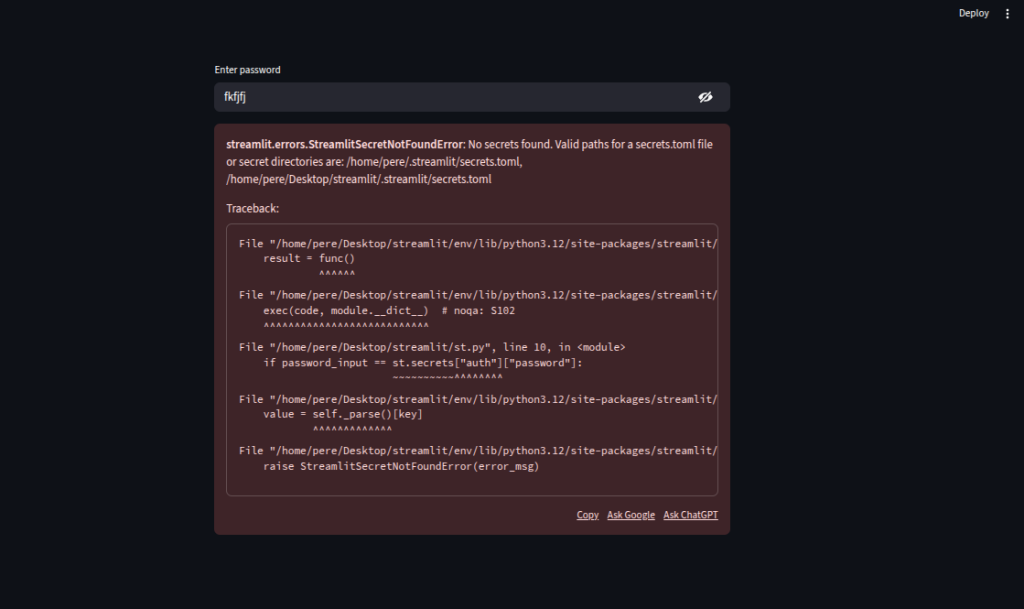
We secure sensitive credentials by storing them in
.streamlit/secrets.tomlinstead of hardcoding them.We use
st.text_input(type="password")to hide the password while typing.We validate user input against
st.secretsto grant or deny access to protected content.We can extend authentication using OAuth with providers like Auth0 or Firebase for more secure, scalable login systems.
We keep user info in
st.session_stateafter login to maintain the session without repeated authentication.
					# ------ Password protection using secrets ------
import streamlit as st

# Store password securely in .streamlit/secrets.toml:
# [auth]
# password = "your_password_here"

password_input = st.text_input("Enter password", type="password")

if password_input == st.secrets["auth"]["password"]:
    st.success("Access granted")
    st.write("Protected content goes here.")
else:
    st.warning("Enter the correct password")

# ------ streamlit run
# ------ OAuth integration with Auth0 or Firebase ------
# Note: Requires setup outside Streamlit and use of libraries like `authlib` or `pyrebase`
#
# Basic flow:
# 1. Redirect user to OAuth provider login page
# 2. Get access token and user info
# 3. Store user info in session state
#
# Streamlit-specific OAuth packages (e.g., streamlit-auth0) can simplify this.
#
# Example placeholder (no real code):
st.info("OAuth integration requires external setup.")
st.write("Use libraries like `authlib` or services like Auth0/Firebase.")

# ------ streamlit run
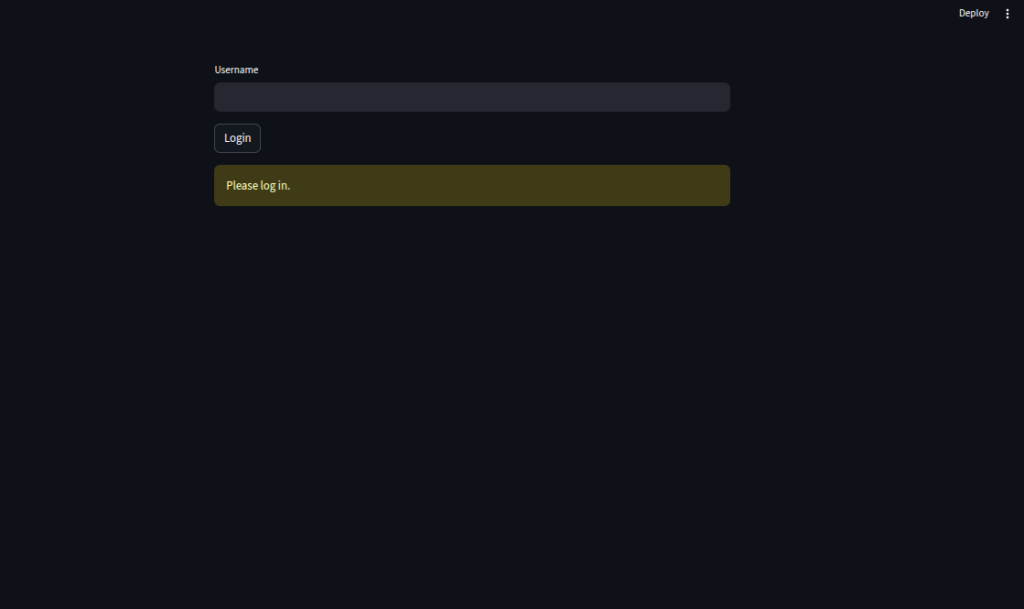
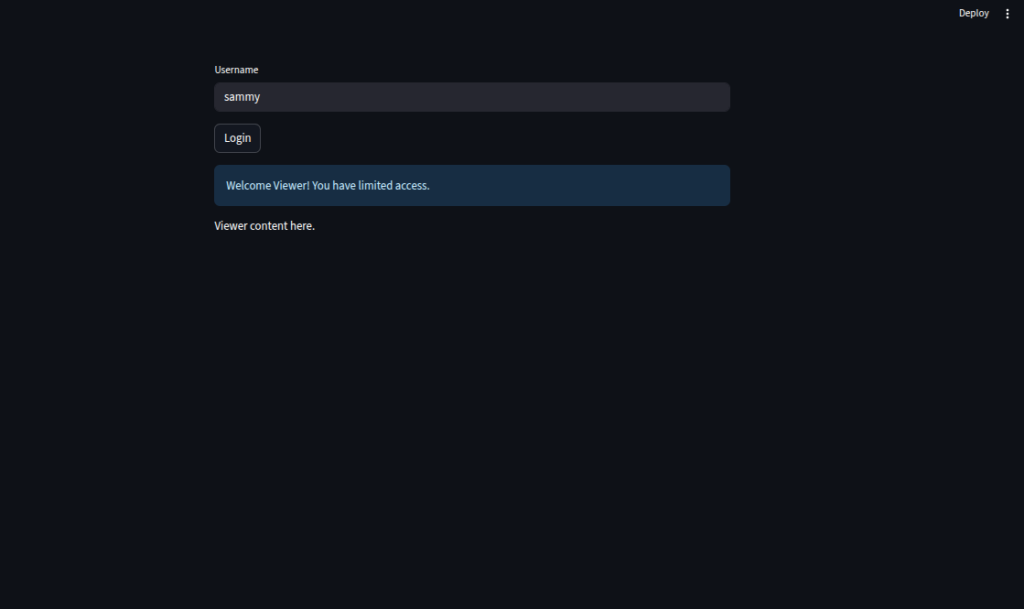
3-4-2
We store the user’s role in
st.session_stateto persist permissions across interactions.We create a simple
login()function that assigns roles (e.g.,"admin"or"viewer") after verifying the user.We display different content and privileges based on the stored role, ensuring access control.
We give admins full access to restricted sections while limiting viewers to basic features.
We maintain the role until logout or app refresh, making the session state the backbone of role management.
					# ------ Building role-based access systems ------
import streamlit as st

# Dummy user role stored in session_state for demo
if "user_role" not in st.session_state:
    st.session_state.user_role = None

def login(user):
    # Normally verify user here
    roles = {"admin": "admin", "user": "viewer"}
    st.session_state.user_role = roles.get(user, "viewer")

user = st.text_input("Username")
if st.button("Login"):
    login(user)

if st.session_state.user_role == "admin":
    st.success("Welcome Admin! You have full access.")
    st.write("Admin content here.")
elif st.session_state.user_role == "viewer":
    st.info("Welcome Viewer! You have limited access.")
    st.write("Viewer content here.")
else:
    st.warning("Please log in.")

# ------ streamlit run
3-5
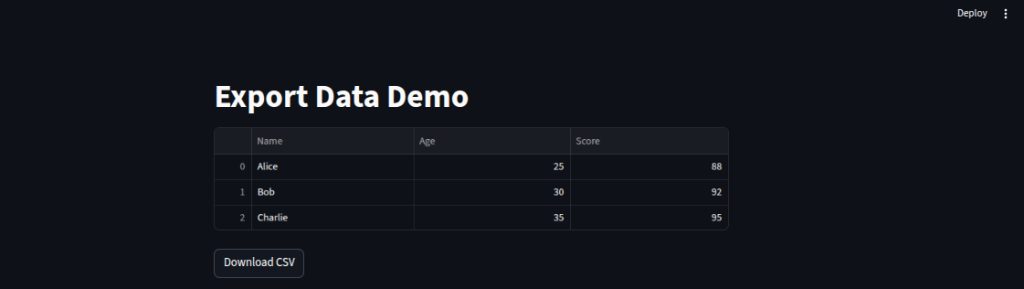
We create a sample DataFrame and display it in the app for users to view the source data before downloading.
We enable CSV export by converting the DataFrame to encoded text and attaching it to a
st.download_button.We add Excel export by writing the DataFrame to a
BytesIObuffer withxlsxwriter, allowing download as.xlsx.We generate a basic PDF report using the
fpdflibrary, iterating through rows to add formatted text.We also implement a file upload system with history tracking, storing uploaded file metadata in
st.session_stateso it persists across interactions.We display the upload history in a table, giving users a clear record of all files submitted during their session.
					# ------ Allow users to download Excel, CSV, or PDF reports ------
import streamlit as st
import pandas as pd
from io import BytesIO
import base64

st.title("Export Data Demo")

# Sample data
df = pd.DataFrame({
    "Name": ["Alice", "Bob", "Charlie"],
    "Age": [25, 30, 35],
    "Score": [88, 92, 95]
})

st.dataframe(df)

# CSV download
csv = df.to_csv(index=False).encode()
st.download_button("Download CSV", csv, "data.csv", "text/csv")

# Excel download
def to_excel(df):
    output = BytesIO()
    with pd.ExcelWriter(output, engine="xlsxwriter") as writer:
        df.to_excel(writer, index=False, sheet_name="Sheet1")
    processed_data = output.getvalue()
    return processed_data

excel_data = to_excel(df)
st.download_button("Download Excel", excel_data, "data.xlsx", "application/vnd.openxmlformats-officedocument.spreadsheetml.sheet")

# PDF download (simple text PDF example)
from fpdf import FPDF

pdf = FPDF()
pdf.add_page()
pdf.set_font("Arial", size=12)
for i, row in df.iterrows():
    pdf.cell(200, 10, txt=f"{row['Name']}, Age: {row['Age']}, Score: {row['Score']}", ln=True)

pdf_bytes = pdf.output(dest='S').encode('latin1')  # Correct way to get PDF as bytes
st.download_button("Download PDF", pdf_bytes, "report.pdf", "application/pdf")

# ------ streamlit run

# ------ Enable upload history or file versioning ------
import streamlit as st

st.title("File Upload with History")

if "uploads" not in st.session_state:
    st.session_state.uploads = []

uploaded_file = st.file_uploader("Upload a file")

if uploaded_file:
    # Save metadata to session state for history
    st.session_state.uploads.append({
        "filename": uploaded_file.name,
        "size": uploaded_file.size,
        "type": uploaded_file.type
    })
    st.success(f"Uploaded {uploaded_file.name}")

st.write("Upload History:")
st.table(st.session_state.uploads)

# ------ streamlit run
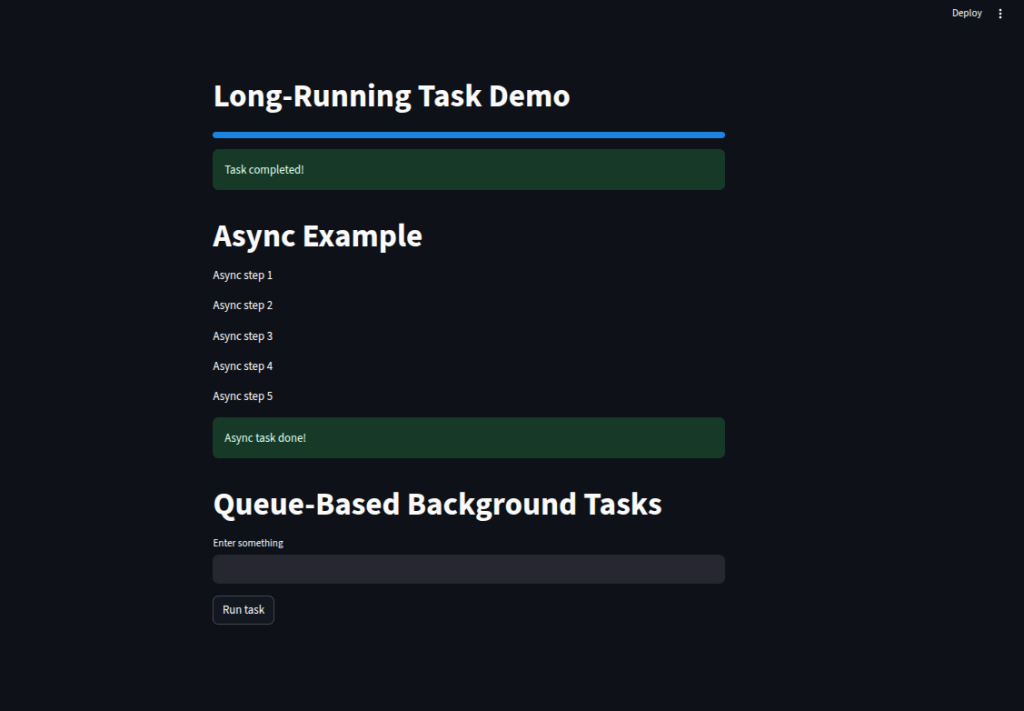
3-6
We demonstrate a long-running task with a real-time progress bar by updating
st.progressinside a loop, simulating work usingtime.sleep().We show an async approach by defining an
asyncfunction withawait asyncio.sleep()to perform non-blocking operations inside Streamlit.We illustrate a queue-based solution using
@st.cache_resourceto store results of expensive computations, avoiding repeated execution for the same input.We provide user feedback during processing with
st.spinner()and a success message upon completion, ensuring the interface stays responsive.
					import streamlit as st
import time

st.title("Long-Running Task Demo")

with st.spinner("Processing... Please wait"):
    progress_bar = st.progress(0)  # create the progress bar once
    for i in range(100):
        time.sleep(0.05)  # simulate work
        progress_bar.progress(i + 1)  # update the existing progress bar

st.success("Task completed!")


# ------ streamlit run
# ------ Using Python async features for background work ------
import streamlit as st
import asyncio

st.title("Async Example")

async def async_task():
    for i in range(5):
        st.write(f"Async step {i+1}")
        await asyncio.sleep(1)

# Run async function inside sync Streamlit app
asyncio.run(async_task())

st.success("Async task done!")

# ------ streamlit run
# ------ Queue-based solutions for long tasks ------
# Example using Streamlit’s experimental queue (requires Streamlit version supporting this)
import streamlit as st

st.title("Queue-Based Background Tasks")

@st.cache_resource
def expensive_task(x):
    time.sleep(5)  # Simulate a time-consuming task
    return f"Result for input {x}"

input_val = st.text_input("Enter something")

if st.button("Run task"):
    with st.spinner("Running task in queue..."):
        result = expensive_task(input_val)
    st.success(result)
3-7
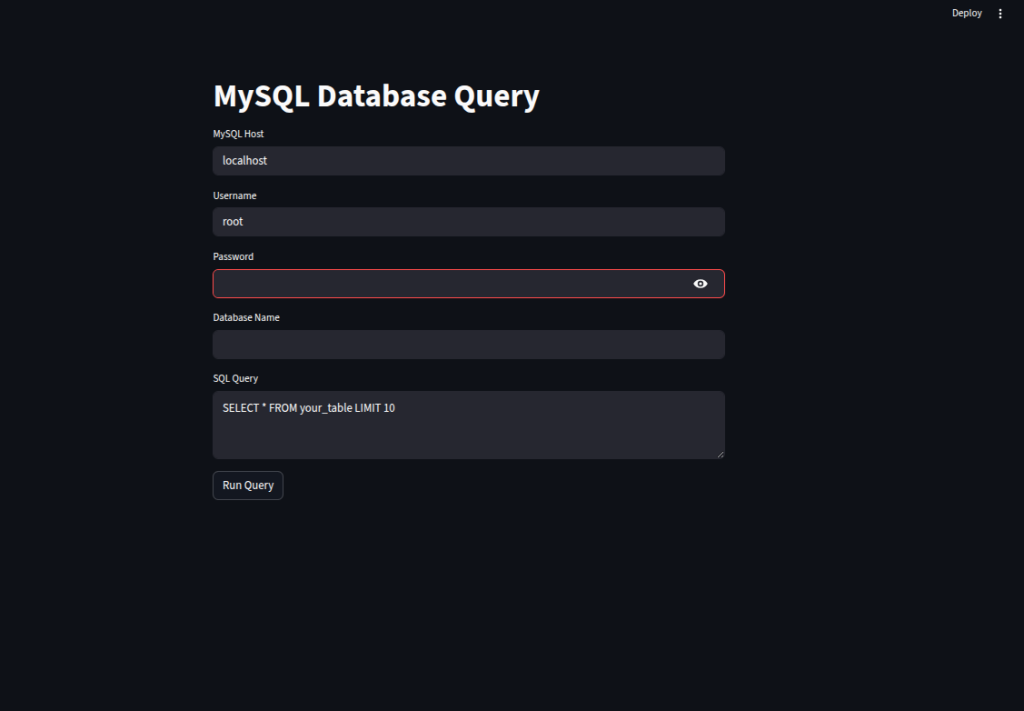
We let the user input database connection details (host, username, password, database name) and a custom SQL query.
We connect to MySQL using
mysql.connector.connect()and execute the provided query through a cursor.We fetch the results with
fetchall(), convert them into a Pandas DataFrame, and display them usingst.dataframe().We handle any database or connection errors gracefully with a try–except block, showing error messages via
st.error().
					# ------ Connecting to MySQL and executing queries ------
import streamlit as st
import mysql.connector
import pandas as pd

st.title("MySQL Database Query")

# Input connection details
host = st.text_input("MySQL Host", "localhost")
user = st.text_input("Username", "root")
password = st.text_input("Password", type="password")
database = st.text_input("Database Name")

query = st.text_area("SQL Query", "SELECT * FROM your_table LIMIT 10")

if st.button("Run Query"):
    try:
        # Connect to MySQL
        conn = mysql.connector.connect(
            host=host,
            user=user,
            password=password,
            database=database,
        )
        cursor = conn.cursor(dictionary=True)
        cursor.execute(query)
        result = cursor.fetchall()
        cursor.close()
        conn.close()

        # Convert result to DataFrame
        df = pd.DataFrame(result)
        st.dataframe(df)

    except Exception as e:
        st.error(f"Error: {e}")

# ------ streamlit run
3 Project
OPENAI_API_KEY = "your_openai_api_key_here"
import os
import streamlit as st
from langchain.chat_models import ChatOpenAI
from langchain.chains import ConversationChain
from langchain.memory import ConversationBufferMemory
# App title
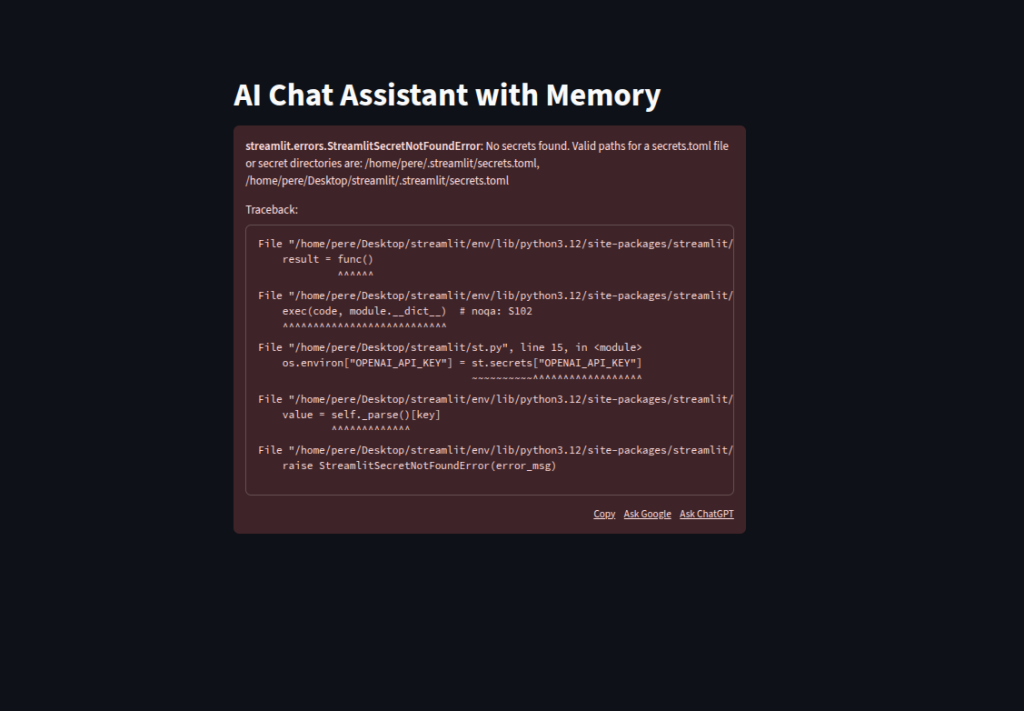
st.title("AI Chat Assistant with Memory")
# Load OpenAI API key
os.environ["OPENAI_API_KEY"] = st.secrets["OPENAI_API_KEY"]
# Initialize memory and chain
if "memory" not in st.session_state:
st.session_state.memory = ConversationBufferMemory()
if "chain" not in st.session_state:
llm = ChatOpenAI(model_name="gpt-4o", temperature=0)
st.session_state.chain = ConversationChain(llm=llm, memory=st.session_state.memory)
# Input form
with st.form("chat_form", clear_on_submit=True):
user_input = st.text_input("You:", key="user_input")
submitted = st.form_submit_button("Send")
# Run chain
if submitted and user_input:
response = st.session_state.chain.invoke(user_input)
st.session_state.last_response = response # Optional display variable
# Show conversation history
if st.session_state.memory.buffer:
st.markdown("### Conversation History")
for line in st.session_state.memory.buffer.strip().split("\n"):
if line.strip():
st.write(line)