Streamlit Table
Streamlit provides multiple ways to display tabular data
These are:
st.table() – Displays a static table.
st.dataframe() – Displays an interactive table with sorting and filtering capabilities.
st.write() – Can also be used to display tables, but is more versatile for various data types.
st.table are the most basic way to display dataframes.
Although it is generally recommended to use st.dataframe for better interactivity., and st.data_editor to let users edit dataframes.
Need a Streamlit developer: Click here
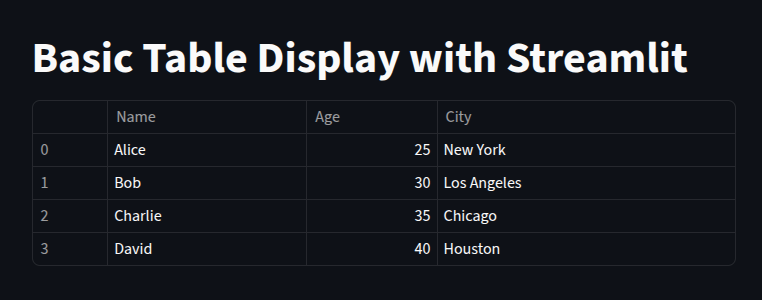
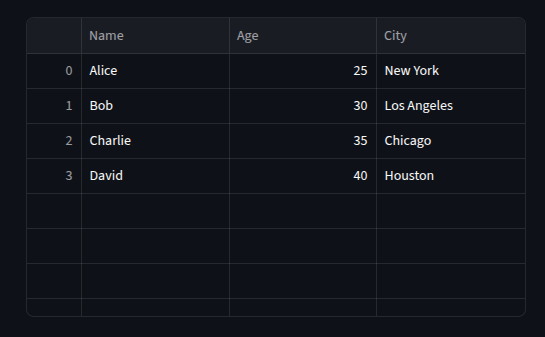
Displaying a simple table using st.table
					import streamlit as st
import pandas as pd

st.title("Basic Table Display with Streamlit")
data = {
    "Name": ["Alice", "Bob", "Charlie", "David"],
    "Age": [25, 30, 35, 40],
    "City": ["New York", "Los Angeles", "Chicago", "Houston"]
}

df = pd.DataFrame(data)
we can use st.table to display the dataframe as a static table.
st.table(df)
This will render the dataframe in a simple, readable format without any interactivity.
Displaying a DataFrame with st.dataframe
st.dataframe provides more interactivity, allowing users to sort and filter the data.
					import streamlit as st
import pandas as pd


data = {
    "Name": ["Alice", "Bob", "Charlie", "David"],
    "Age": [25, 30, 35, 40],
    "City": ["New York", "Los Angeles", "Chicago", "Houston"]
}

df = pd.DataFrame(data)

st.title("Interactive DataFrame Display with Streamlit")
st.dataframe(df)
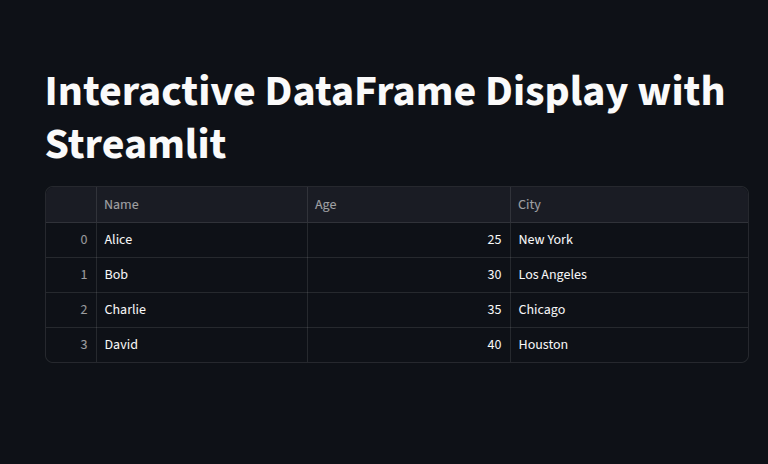
This will render the dataframe with interactive features, allowing users to sort and filter the data as needed.
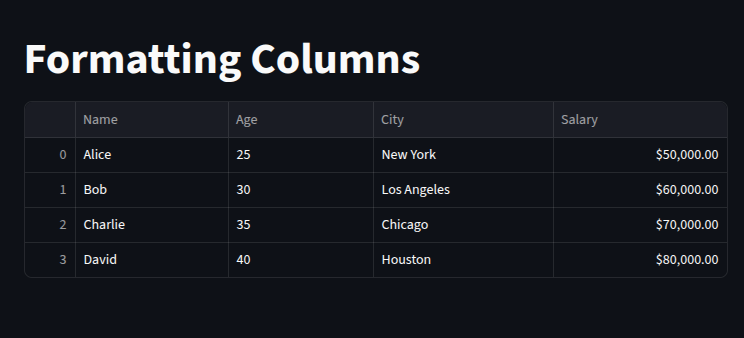
Going further with st.dataframe, we can customize the display.
let’s format numeric columns using pandas.
					import streamlit as st
import pandas as pd


st.title("Formatting Columns")

data = {
    "Name": ["Alice", "Bob", "Charlie", "David"],
    "Age": [25, 30, 35, 40],
    "City": ["New York", "Los Angeles", "Chicago", "Houston"]
}

df = pd.DataFrame(data)

df["Salary"] = [50000, 60000, 70000, 80000]
df["Age"] = df["Age"].astype(str)  # Convert Age to string for formatting

st.dataframe(df.style.format({
    "Salary": "${:,.2f}"  # Format Salary as currency
}))
Highlighting cells based on conditions
we can use pandas style to highlight certain values
					data = {
    "Name": ["Alice", "Bob", "Charlie", "David"],
    "Age": [25, 30, 35, 40],
    "City": ["New York", "Los Angeles", "Chicago", "Houston"]
}

df = pd.DataFrame(data)

st.dataframe(df.style.applymap(lambda x: "background-color: red" if isinstance(x, int) and x > 30 else "", subset=["Age"]))
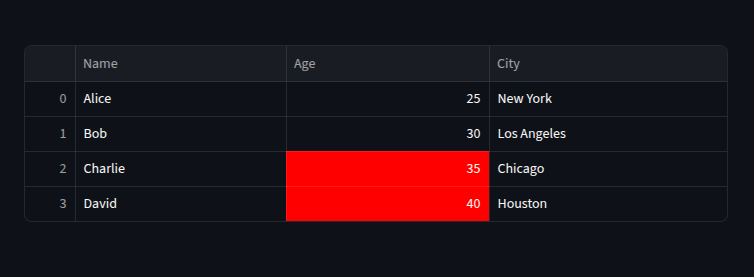
This works with both st.dataframe() and st.table() (static colors).
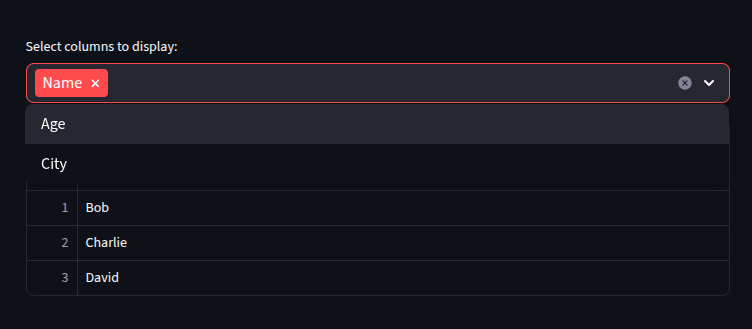
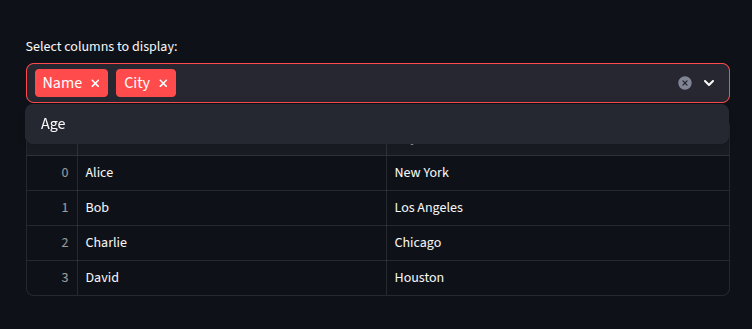
Selecting Columns or Rows
We can select specific columns or rows to display in the table.
This is useful when we want to focus on certain parts of the data.
					data = {
    "Name": ["Alice", "Bob", "Charlie", "David"],
    "Age": [25, 30, 35, 40],
    "City": ["New York", "Los Angeles", "Chicago", "Houston"]
}

df = pd.DataFrame(data)

options = st.multiselect("Select columns to display:", df.columns.tolist())
st.dataframe(df[options])
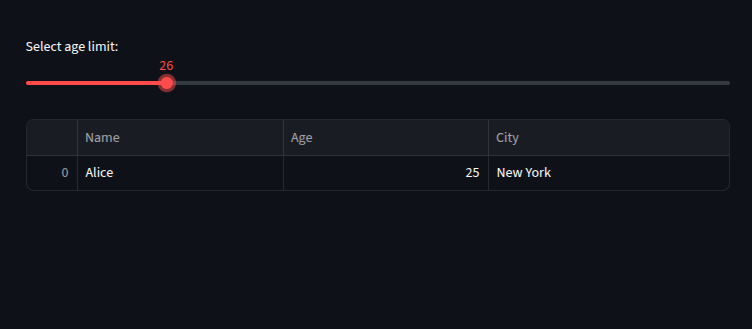
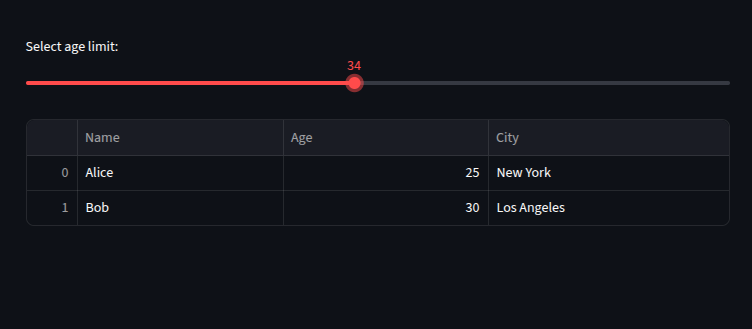
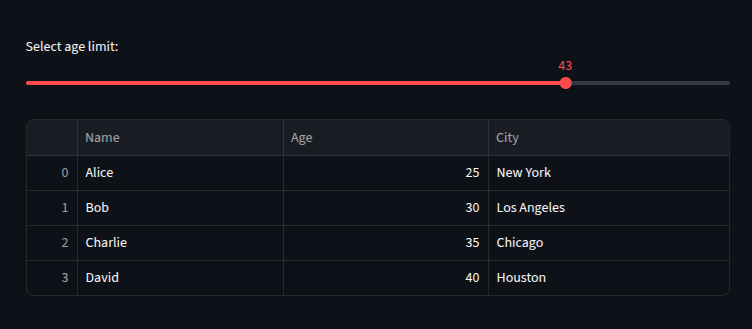
					data = {
    "Name": ["Alice", "Bob", "Charlie", "David"],
    "Age": [25, 30, 35, 40],
    "City": ["New York", "Los Angeles", "Chicago", "Houston"]
}

df = pd.DataFrame(data)

age_limit = st.slider("Select age limit:", 20, 50, 30)
filtered_df = df[df["Age"] <= age_limit]

st.dataframe(filtered_df)
Displaying Large Tables
we can use st.dataframe() for scrolling, st.table() for static displays.
for huge data , we can set the height and width of the table.
					data = {
    "Name": ["Alice", "Bob", "Charlie", "David"],
    "Age": [25, 30, 35, 40],
    "City": ["New York", "Los Angeles", "Chicago", "Houston"]
}

df = pd.DataFrame(data)

st.dataframe(df, height=300, width=500)
Downloading Data from Tables
We can allow users to download the data displayed in the table.
This is useful for exporting data for further analysis or reporting.
data = {
    "Name": ["Alice", "Bob", "Charlie", "David"],
    "Age": [25, 30, 35, 40],
    "City": ["New York", "Los Angeles", "Chicago", "Houston"]
}

df = pd.DataFrame(data)
csv = df.to_csv(index=False)
st.download_button("Download CSV", csv, file_name="data.csv", mime="text/csv")

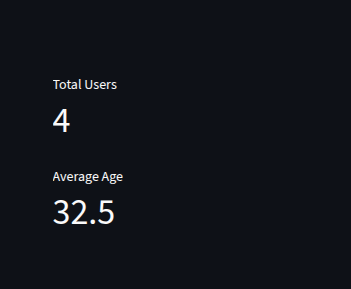
Using st.metric for Key Metrics
					data = {
    "Name": ["Alice", "Bob", "Charlie", "David"],
    "Age": [25, 30, 35, 40],
    "City": ["New York", "Los Angeles", "Chicago", "Houston"]
}

df = pd.DataFrame(data)

st.metric(label="Total Users", value=len(df))
st.metric(label="Average Age", value=df["Age"].mean())
key Takeaways
st.table()→ static table.st.dataframe()→ interactive, scrollable, sortable.Use
pandas.DataFrame.stylefor formatting and highlighting.Combine with widgets (
st.slider,st.selectbox) to filter dynamically.Use
st.download_buttonto export table data.
Want to learn more about Streamlit: CLICK HERE
Watch more on streamlit :