Streamlit DataFrame

Streamlit provides a powerful way to display and interact with data using DataFrames.
DataFrames in Streamlit are typically used to display tabular data, allowing users to visualize and interact with datasets easily.
 
Need a Streamlit developer: Click here

1. Introduction

we would be using Pandas DataFrames to demonstrate how to use these features in Streamlit.
				
					import streamlit as st
import pandas as pd


data = {    "Name": ["Alice", "Bob", "Charlie", "David"],
    "Age": [25, 30, 35, 40],
    "City": ["New York", "Los Angeles", "Chicago", "Houston"]
}


df = pd.DataFrame(data)

st.title("Streamlit DataFrame Example")
st.write("This is a simple DataFrame displayed using Streamlit.")
st.dataframe(df)

st.table(df)

st.data_editor(df)


2. Display Options


st.dataframe(df, width=500, height=300, use_container_width=True)
				
			
The `use_container_width` parameter allows the DataFrame to take the full width of the container, making it responsive.
This is useful for creating responsive layouts in Streamlit applications.
The `width` and `height` parameters can be adjusted to control the size of the DataFrame display.
The `st.dataframe()` function creates an interactive table that allows users to sort, filter, and scroll through the data.
It provides a more dynamic experience compared to `st.table()`, which displays a static table without interactivity.
we can also set the column format
				
					st.dataframe(df.style.format({"Name": "New Name"}))


3. Static Tables

we use st.table() to create a static table that does not allow user interaction.
				
					st.table(df)
				
			
This is useful for displaying data that does not require user interaction, such as summary statistics or fixed datasets.
The `st.table()` function creates a static table that displays the data without interactivity.
It is useful for displaying data that does not require user interaction, such as summary statistics or fixed datasets.

4. Sorting and Styling

Streamlit allows you to sort and style DataFrames easily.
Panda’s styler object can be used to apply styles to DataFrames before displaying them in Streamlit.
				
					styled_dataframe = df.style.highlight_max(axis=0).set_properties(**{'background-color': 'lightblue', 'color': 'black'})
st.dataframe(styled_dataframe)


5. Conditional Formatting

You can apply conditional formatting to DataFrames to highlight specific values or ranges.
 
				
					styled_df = df.style.applymap(lambda x: "background-color: yellow" if x == 'New York' else "", subset=['City'])
st.dataframe(styled_df)
				
			
This example highlights the ‘City’ column where the value is ‘New York’.

6. Interactive Filtering

we can create filters above the DataFrame
				
					filter_city = st.selectbox("Select City", df['City'].unique())
filtered_df = df[df['City'] == filter_city]
st.write(f"Filtered DataFrame for City: {filter_city}")
st.dataframe(filtered_df)


7. Editable DataFrames

Streamlit provides an editable DataFrame widget that allows users to modify the data directly in the app.
				
					edited_df = st.data_editor(df, num_rows="dynamic", key="editable_df")
st.write("Edited DataFrame:")
st.dataframe(edited_df)
				
			
This allows users to edit the DataFrame directly in the Streamlit app, making it easy to update data on the fly.
The `num_rows=”dynamic”` parameter allows the DataFrame to adjust its size based on the number of rows in the data.

8. Downloading DataFrames

Streamlit provides a convenient way to create a download button for files or data.
				
					csv = df.to_csv(index=False).encode("utf-8")
st.download_button("Download CSV", csv, "data.csv", "text/csv")
				
			
This code creates a DataFrame and provides a button to download it as a CSV file.

9. Real Data Example

we can load data from CSV and explore it.
				
					 uploaded_file = st.file_uploader("Upload CSV", type="csv")
 
 
 if uploaded_file:
    user_df = pd.read_csv(uploaded_file)
    st.dataframe(user_df)
    st.write("Summary Statistics:", user_df.describe())
				
			
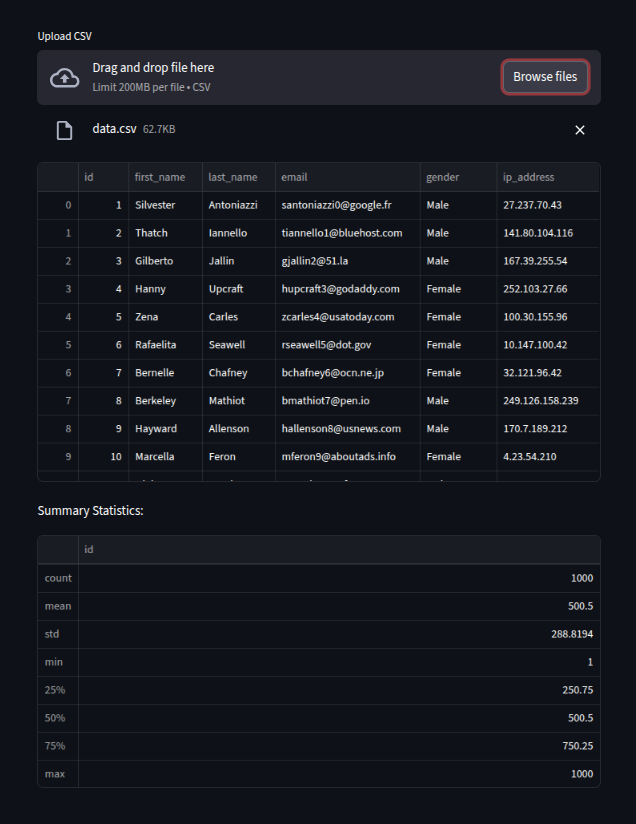
This allows users to upload their own CSV files and explore the data interactively.

10. API + DataFrame

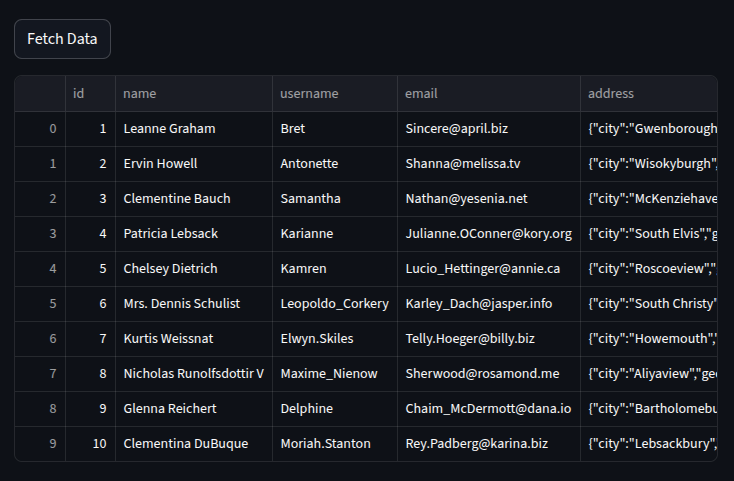
You can also use DataFrames to display data fetched from APIs.
				
					import requests

if st.button("Fetch Data"):
    res = requests.get("https://jsonplaceholder.typicode.com/users")
    if res.ok:
        api_df = pd.DataFrame(res.json())
        st.dataframe(api_df)


You wanna learn more about streamlit: Click here

Watch the video below for more on streamlit

Leave a Reply

Your email address will not be published. Required fields are marked *