Spearman Rank Correlation [Simply explained]
					import numpy as np
from scipy import stats
import pandas as pd
Example 1 Manual
					# Step 1: Grab the data
hits = np.array([150, 180, 120, 210, 160])
rbis = np.array([75, 90, 50, 110, 85])
					# Step 2: Rank the data
hits_rank = stats.rankdata(hits)
rbis_rank = stats.rankdata(rbis)
					# Step 3: Calculate the rank differences and their squares
d = hits_rank - rbis_rank
d_squared = d ** 2
					# Step 4: Apply the Spearman formula
n = len(hits)
spearman_manual = 1 - (6 * np.sum(d_squared)) / (n * (n**2 - 1))
					# Print the manually calculated Spearman correlation
print(f"Manual Spearman Correlation: {spearman_manual}")
Example 2 Fast wth scipy
					# Step 1: Calculate Spearman's rank correlation using scipy
spearman_corr, p_value = stats.spearmanr(hits, rbis)
					# Print the Spearman correlation coefficient and p-value
print(f"Spearman Correlation: {spearman_corr}")
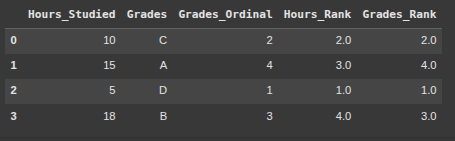
Example 3 Ordinal Data with pandas
					data = {
    'Hours_Studied': [10, 15, 5, 18],
    'Grades': ['C', 'A', 'D', 'B']
}
					# Create DataFrame
df = pd.DataFrame(data)
					# Convert Grades to numerical ordinal data
grade_mapping = {'A': 4, 'B': 3, 'C': 2, 'D': 1}
df['Grades_Ordinal'] = df['Grades'].map(grade_mapping)
					# Rank the data using pandas
df['Hours_Rank'] = df['Hours_Studied'].rank()
df['Grades_Rank'] = df['Grades_Ordinal'].rank()
df.head(5)
spearman_corr = df[['Hours_Rank', 'Grades_Rank']].corr(method='spearman').iloc[0, 1]
print(f"Spearman correlation: {spearman_corr:.3f}")
