python standard error of the mean
					import numpy as np
from scipy import stats
import matplotlib.pyplot as plt
np.random.seed(11)
Example 1 - Manual Calculation - Strikeouts Per Season
data = [110, 112, 231, 213, 161, 123, 221, 316, 218, 219]
					# Step 1: Calculate the sample size (n)
n = len(data)
print(n)
					# Step 2: Calculate the standard deviation (s)
std_dev = np.std(data, ddof=1)  # ddof=1 to get the sample standard deviation
print(std_dev)
					# Step 3: Calculate the Standard Error of the Mean (SEM)
sem = std_dev / np.sqrt(n)
print(sem)
Example 2 Scipy
					# Calculate the Standard Error of the Mean (SEM) using scipy
sem_scipy = stats.sem(data)
print(sem_scipy)
Example 3 Marathon Times
marathon_times = np.random.normal(loc=240, scale=30, size=5000)
print("First 10 marathon times:", marathon_times[:10])
					def compute_standard_error(data, sample_size):
        sample = np.random.choice(data, size=sample_size, replace=False)
        se = stats.sem(sample)  # Use scipy.stats.sem correctly here
        return se, np.mean(sample)
					# Sample sizes and result storage
sample_sizes = [50, 500, 5000]
results = {}
					# Calculate standard error for each sample size
for size in sample_sizes:
    se, sample_mean = compute_standard_error(marathon_times, size)
    results[size] = {'SE': se, 'Mean': sample_mean}
					# Output results
for size, stats in results.items():
    print(f"Sample Size: {size} | Standard Error: {stats['SE']:.4f} | Sample Mean: {stats['Mean']:.2f}")

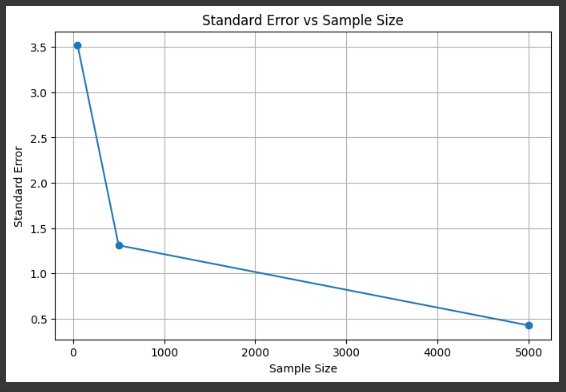
Example viz
					sizes = list(results.keys())
errors = [results[size]['SE'] for size in sizes]
					plt.figure(figsize=(8, 5))
plt.plot(sizes, errors, marker='o')
plt.title('Standard Error vs Sample Size')
plt.xlabel('Sample Size')
plt.ylabel('Standard Error')
plt.grid(True)
plt.show()

Ryan is a Data Scientist at a fintech company, where he focuses on fraud prevention in underwriting and risk. Before that, he worked as a Data Analyst at a tax software company. He holds a degree in Electrical Engineering from UCF.
