In Python, a quantile is a statistical term used to describe a point or value below which a certain proportion of the data falls.
It means a quntile split data into intervals.
We start by importing numpy and pandas.
numpy is used for high-performance numerical computation.
Pandas is used for data manipulation, data analysis and also for working with tabular data
					import numpy as np
import pandas as pd
Example 1 - Quartiles
Here, we define a list of numbers and we store it in a variable called data.
data = [13, 74, 11, 12, 56, 33, 18, 7, 93, 55]
np.percentile(data, 25)gives the value below which 25% of the data falls.np.percentile(data, 50)is the median.np.percentile(data, 75)gives the value below which 75% of the data falls.
					Q1 = np.percentile(data, 25)
Q2 = np.percentile(data, 50)  # This is also the median
Q3 = np.percentile(data, 75)
print( f'Q1: {Q1}, Q2: { Q2}, Q3: {Q3}')
Example 2 Deciles
D1 (10%): 10% of the data falls below this value.
D9 (90%): 90% of the data falls below this value.
					D1 = np.percentile(data, 10)
D9 = np.percentile(data, 90)
print(f'D1: {D1}, D9: {D9}')
Example 3 Percentiles
P11: The value below which 11% of the data falls.P53: The value below which 53% of the data falls.
					# Calculate Percentiles
P11 = np.percentile(data, 11)
P53 = np.percentile(data, 53)
print(f'P11 : {P11}, P53 : {P53}')
Example 4 dataframe column
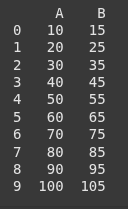
Let’s create a new dataframe.
					df = pd.DataFrame({
    'A': [10, 20, 30, 40, 50, 60, 70, 80, 90, 100],
    'B': [15, 25, 35, 45, 55, 65, 75, 85, 95, 105]
})
print(df)
Here we use pandas to check the quantile.
Pandas uses interpolation to calculate quartiles between data points.
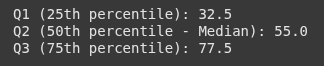
					# Calculate Quartiles for column 'A'
Q1 = df['A'].quantile(0.25)
Q2 = df['A'].quantile(0.50)
Q3 = df['A'].quantile(0.75)
					print(f"Q1 (25th percentile): {Q1}")
print(f"Q2 (50th percentile - Median): {Q2}")
print(f"Q3 (75th percentile): {Q3}")
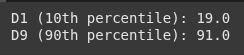
					# Calculate Deciles for column 'A'
D1 = df['A'].quantile(0.10)
D9 = df['A'].quantile(0.90)

print(f"D1 (10th percentile): {D1}")
print(f"D9 (90th percentile): {D9}")
					P22 = df['A'].quantile(0.22)
P50 = df['A'].quantile(0.50)
P71 = df['A'].quantile(0.71)

print(f"P25 (25th percentile): {P22}")
print(f"P50 (50th percentile): {P50}")
print(f"P75 (75th percentile): {P71}")
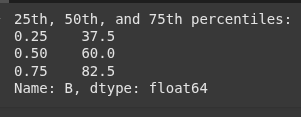
Example pandas shortcut
					# Calculate multiple quantiles at once for a DataFrame column
quantiles_B = df['B'].quantile([0.25, 0.50, 0.75])

print(f"25th, 50th, and 75th percentiles: \n{quantiles_B}")