Pandas Columns
Pandas Dataframes are composed of Rows and Columns. In this guide we are going to cover everything you need to know about working with columns.
The article is based on a tutorial we published on our YouTube channel. Feel free to check it out below.
Let’s start with importing in Pandas and NumPy.
					import pandas as pd
import numpy as np
Here we define a dataset containing records of eight runners.
Each entry includes:
The runners first and last name.
Thier finish times in hours for threee race types:
- Marathon
- 50-miler
- 100-miler
The date of their last race and a running_clud_id showing which running club each runner belongs to.
					data = {
    'Runner': ['Alice', 'Bob', 'Charlie', 'Diana', 'Ethan', 'Fiona', 'George', 'Hannah'],
    'last_name': ['Morgan', 'Thompson', 'Reed', 'Santiago', 'Kim', 'Nguyen', 'Patel', 'Brooks'],
    'Marathon_Time_hrs': [3.5, 4.0, 3.2, 4.5, 3.8, 4.1, 3.9, 4.3],
    'Fifty_Miler_Time_hrs': [8.0, 9.5, 7.8, 10.2, 9.0, 10.0, 9.2, 10.5],
    'Hundred_Miler_Time_hrs': [20.5, 23.0, 18.7, 25.2, 21.5, 24.1, 22.3, 26.0],
    'last_race_date': ['04/27/2025', '05/24/2025', '12/13/2025', '04/27/2025', '05/24/2025', '12/13/2025', '04/27/2025', '05/24/2025'],
    'running_club_id': [123, 345, 123, 678, 342, 123, 345, 123],
}
Next, we create a tabular structure with pandas DataFrame.
We create this so we can perform data anaylsis and manipulation using pandas.
df = pd.DataFrame(data)
df.head()

Example 1 Access Column Version 1
Here we access the Runner column using df[‘Runner’]
df['Runner']

Example 2 Access Column Version 2
We can also access the Runners column by using df.Runner
df.Runner

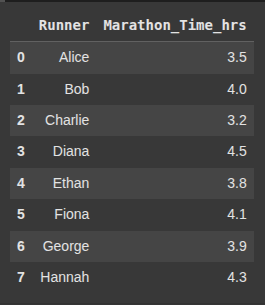
Example 3 access multiple columns
Here we get two columns ‘Runner’ and ‘Marathon_Time_hrs’.
Note the double square bracket, we use it when we want to access multiple columns
df[['Runner', 'Marathon_Time_hrs']]
Example 4 get all columns Version 1
We use .columns to see all the columns in the DataFrame.
df.columns

unlike .columns whihc returns the index,
.columns.values returns a numpy array of the column names
df.columns.values

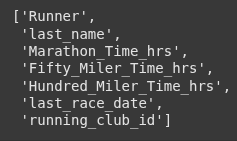
Example 5 get all columns Version 2 - list
Using the list() metthod is a quick way to get a list of all column names.
list(df)
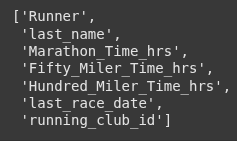
list(df.columns)
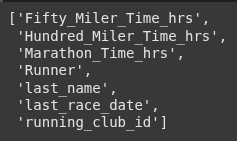
Example 6 get all columns Version 3 - Sorted
we use the sorted() method to sort the column names and return them as a list.
It does not chnage the DataFrame, it only gives us the sorted list of column headers.
sorted(df)
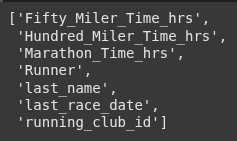
sorted(df.columns)
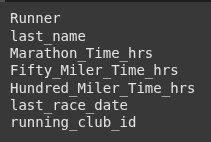
Example 6 get all columns Version 4 - Loop
We use a for loop to iterate over df.columns so that we can display each colum name individually.
for column_name in df.columns:
	print(column_name)
Example 7 get all columns Version 5 - keys
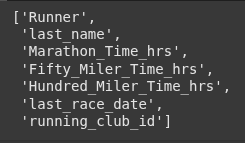
.keys() returns the DataFrame’s column labels,
.tolist() converts the keys into a regular Python list.
df.keys().tolist()
Example 8 what if a dataframe has hundreds of columns - two ways to display max columns
Here we create a dataframe with 100 columns.
We use random.rand to generate a 2D array with the shape defined by num_rows and num_cols.
Each element is a random float between 0 and 1.
					num_rows = 10
num_cols = 100
data = np.random.rand(num_rows, num_cols)
Here, we use list comprehension to generate names like ‘col_1’, ‘col_2’ up to the number of columns (num_cols).
column_names = [f'col_{i+1}' for i in range(num_cols)]
Next, we create a new DataFrame using the random data and assigns the generated column names.
df_100 = pd.DataFrame(data, columns=column_names)
df_100

pd.set_option('display.max_columns', None)
pd.options.display.max_columns = None sets the same option as pd.set_option('display.max_columns', None), ensuring no columns get hidden in the output view. It’s just a different syntax to control display settings.
pd.options.display.max_columns = None
df_100

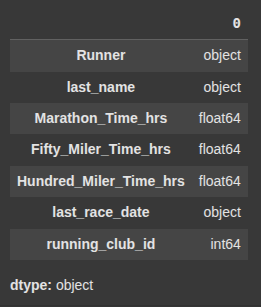
Example 9 column types
This returns a Series listing the tyoe (e.g int, float or object) for every column.
df.dtypes
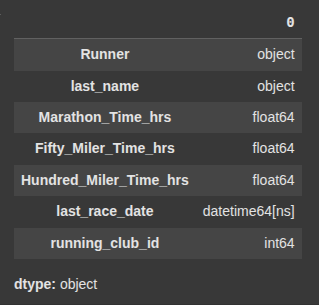
Example 10 convert column types - date time
.to_datetime() transforms string dates into panda’s datetime format.
df['last_race_date'] = pd.to_datetime(df['last_race_date'])
df.dtypes
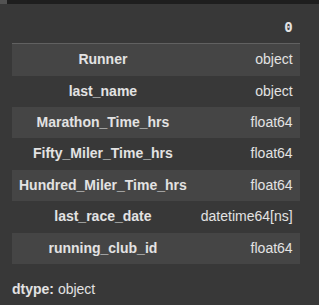
Example 11 convert column types - numeric - TO DO
Here, using .astype(‘float’) we convert interger IDs into floating-point numbers.
df['running_club_id'] = df['running_club_id'].astype('float')
df.dtypes
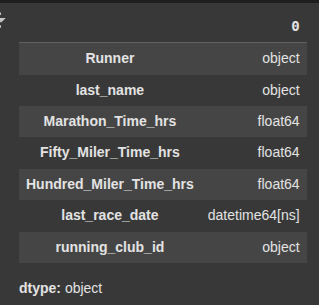
Example 12 convert column types - string
Here we chnage the data type of ‘runnung_clud_id’ to text(strings).
df['running_club_id'] = df['running_club_id'].astype(str)
df.dtypes
Example 13 Rename Column
Here we use .rename() to change the column name ‘Marathon_Tine_hrs’ to ‘262_Timr_hrs’.
The inplace=True updates te DataFrame directly without needing to assign it to new variables.
df.rename(columns={'Marathon_Time_hrs': '262_Time_hrs'}, inplace=True)
Example 14 Create new column from numbers
Here, we add up the hours from different columns and create a new one called ‘total_times’.
df['total_times'] = df['262_Time_hrs'] + df['Fifty_Miler_Time_hrs'] + df['Hundred_Miler_Time_hrs']
Example 15 create new column from strings
Here, we combine ‘Runner’ and ‘last_name’ columns with a space in between.
The full_name column stores the complete name of each person.
df['full_name'] = df['Runner'] + ' ' + df['last_name']
Example 16 create new column from new data
shirt_sizes = ['S', 'M', 'M', 'L', 'M', 'S', 'L', 'XL']
Here we create a new column called ‘race_shirt_size’ using the created shirt_sizes data
df['race_shirt_size'] = shirt_sizes
Example 17 drop column
Here we delete the specified column from the DataFrame.
df.drop(columns=['race_shirt_size'], inplace=True)
Example 18 reorder columns
Here we reorder and selec specific columns from the DataFrame.
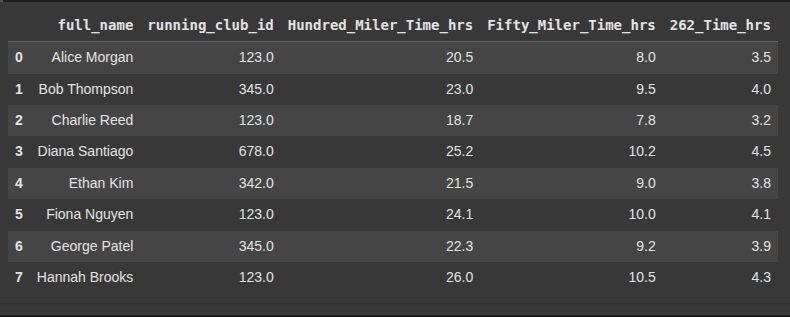
df = df[['full_name', 'running_club_id', 'Hundred_Miler_Time_hrs', 'Fifty_Miler_Time_hrs', '262_Time_hrs']]
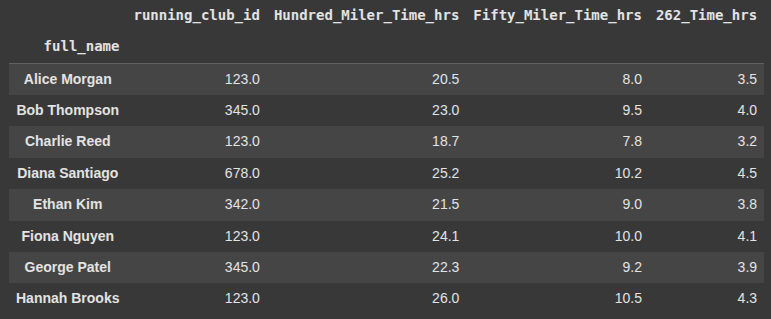
Example 19 - Set Index
Here we use the .set_index() to make the full_name column the new row labels(index).
df.set_index("full_name")
Example 20 set multiple columns as index
Here we set a multi-level index using both ‘full_name’ and ‘running_club_id’
df = df.set_index(['full_name', 'running_club_id'])
Example 21 - reset index
Here we use .reset_index() to restore ‘full_name’ and ‘running_club_id’ from the index to normal columns, making the DataFrame flat again.
df = df.reset_index()
df
Example 22 - Get only numeric columns
This extracts the names of all numeric columns in the DataFrame.
numeric_columns = df._get_numeric_data().columns
numeric_columns

Example 23 Describe
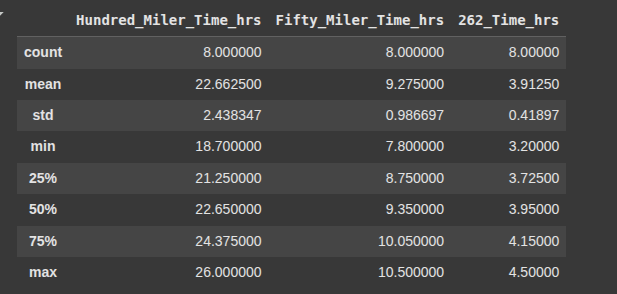
.describe() provide key stats like
mean, standard deviation, min, max and percentile.
df.describe()
Example 24 Set Column Names post creation
Here we build a DataFrame from a list of lists where each inner list is a row.
df2 = pd.DataFrame([['23:12', '22:11', '21:00', '20:30', '19:55', '18:55']])
df2

Next we assign custom column names to the DataFrame df2.
df2.columns = ['Race_1','Race_2','Race_3','Race_4','Race_5','Race_6']
SECTION ON CLEANING UP COLUMNS Values
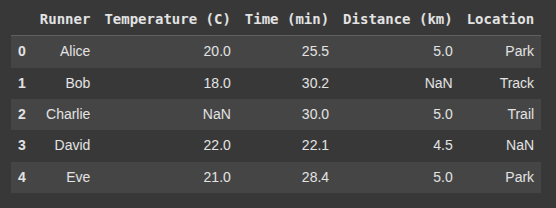
The data includes runners’ names, temperatures, times, distances, and locations. Some entries use np.nan to represent missing or unknown values
					data3 = {
    'Runner': ['Alice', 'Bob', 'Charlie', 'David', 'Eve'],
    'Temperature (C)': [20, 18, np.nan, 22, 21],
    'Time (min)': [25.5, 30.2, np.nan, 22.1, 28.4],
    'Distance (km)': [5.0, np.nan, 5.0, 4.5, 5.0],
    'Location': ['Park', 'Track', 'Trail', np.nan, 'Park'],
}
Using pd.DataFrame(data3) we organize the raw dictionary data into a tabular format with rows and columns,
df3 = pd.DataFrame(data3)
Example 25 Missing Values single column
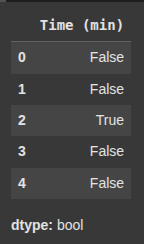
This returns a boolean Series where “True” marks rows with missing time values, helping identify incomplete data.
df3['Time (min)'].isna()
Example 26 all columns that have a null value
df3.isna().any() checks which columns contain any NaNs, and using df3.columns[...] selects their names. Finally, .tolist() converts the result into a regular Python list.
df3.columns[df3.isna().any()].tolist()
Example 27 Fill Value
fillna(30) replaces all NaN entries with the number 30.
df3['Time (min)'] = df3['Time (min)'].fillna(30)
Example 27 Drop Rows will null value in column
f3.dropna(subset=['Distance (km)']) drops all rows with NaN in the 'Distance (km)' column, helping clean the data by keeping only entries with valid distances.
df3_drop = df3.dropna(subset=['Distance (km)'])

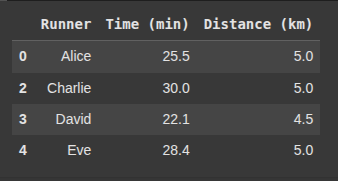
Example 28 drop the column if null value
dropna(axis=1) drops columns with at least one NaN.
df3_drop_column = df3_drop.dropna(axis=1)
df3_drop_column
Example 29 Insert
fahrenheit = df3['Temperature (C)'] * 9/5 + 32
Here, we insert the new fahrenheit column into the DataFrame
df3.insert(2, 'Temperature (F)', fahrenheit)
df3

SECTION ON CLEANUP COLuMN NAMES
					df4 = pd.DataFrame({
    ' Runner Name ': ['Alex', 'Bri', 'Chris'],
    ' Total Time ': [45, 50, 42],
    'Average Pace': [5.0, 5.5, 4.8],
    '  Calories Burned  ': [300, 320, 310]
})

Example 30 remove spaces on the end
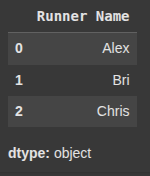
Here, we remove any leading or trailing spaces from column names using .strip() method.
df4.columns = df4.columns.str.strip()
df4

df4['Runner Name']
Example 31 remove spaces and replace with underscore
This replaces spaces in all column names with underscores (_), by using .replace()
df4.columns = df4.columns.str.replace(' ', '_')
df4

Example 32 make lowercase
Here we use the .lower() method to make the columns lower case.
df4.columns = df4.columns.str.lower()

Example 33 Filter Column
Here we filter the DataFrame by checking the column (avaerage_pace) thats greater than 5
df4[df4['average_pace'] > 5]

Example 34 Filter Column AND
The & operator combines both conditions
This filters df4 to show rows where:
'calories_burned'is less than 350, and'total_time'is greater than 43.
df4[(df4['calories_burned'] < 350) & (df4['total_time'] > 43)]

Example 35 Filter Column OR
This filters df4 to show rows where either condition is true:
'calories_burned'is less than 350, or'total_time'is greater than 43.
The | operator means “OR”, so rows meeting at least one of the conditions will be included in the result.
df4[(df4['calories_burned'] < 350) | (df4['total_time'] > 43)]

Example 36 loc
df4.loc[0, 'total_time'] uses .loc[] to access data by label/index, returning a single cell’s value.
This retrieves the value from the 'total_time' column in the first row (index 0).
df4.loc[0, 'total_time']
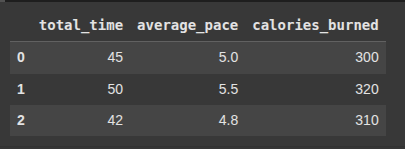
Example 37 loc
This selects all rows and the columns from 'total_time' to 'calories_burned', inclusive.
Using df4.loc[:, 'total_time':'calories_burned'] slices the DataFrame to return only those columns in that range, across all rows
df4.loc[:, 'total_time':'calories_burned']
Example 38 loc
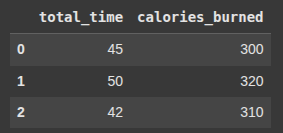
This selects all rows and only the 'total_time' and 'calories_burned' columns from df4.
df4.loc[:, ['total_time','calories_burned']] uses label-based indexing to extract specific columns across the entire dataset
df4.loc[:, ['total_time','calories_burned']]
Example 39 iloc
This gets the value at the first row and first column of df4
df4.iloc[0, 0] uses integer-based indexing to return a single cell’s value
df4.iloc[0, 0]
Example 40 iloc
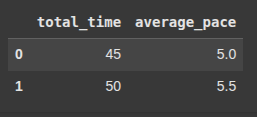
This selects a specific range of rows and columns by position.
df4.iloc[0:2, 1:3] returns rows 0 and 1 (Python excludes the end index) and columns at positions 1 and 2.
df4.iloc[0:2, 1:3]
Final Thoughts
Thank you for checking out this tutorial on Pandas Columns. Make sure to read our other Pandas content on the blog
Ryan is a Data Scientist at a fintech company, where he focuses on fraud prevention in underwriting and risk. Before that, he worked as a Data Analyst at a tax software company. He holds a degree in Electrical Engineering from UCF.
