#similiar to t test for independent samples
#that t test looks at the mean
#mann-whitney u loks at rank sum difference
#sort from smallest to largest (smallest rank 1 largest last rank)
#example rank group 1 sum 36 rank group sum 2 42
#confirm data is not normally distributed
#write null and alternative hypothesis
#The Mann-Whitney U Test is a non-parametric statistical test used to determine if there is a
#significant difference between the distributions of two independent groups.
#It’s often used as an alternative to the t-test when the assumption of normality is not met
#ALSO KNOWN AS THE (Wilcoxon rank-sum test)
#robust against outliers and suitable for non-normal distributions. This test specifically evaluates
#whether one distribution tends to have higher (or lower) values than the other.
#You have two independent samples.
#The samples may not follow a normal distribution.
#You want to check for a difference in medians between the two groups rather than means
#For example, you could use it to compare customer satisfaction scores between two branches
#of a business or evaluate if there’s a difference in heart rates between two groups of patients
#The samples are independent (i.e., they do not come from paired or matched samples).
#The variable being tested is continuous or ordinal (rankable data).
#The distribution shapes between the groups should be similar for accurate interpretation
#Manual Example
#two-sided
#one-tail
					import numpy as np
from scipy.stats import mannwhitneyu, shapiro
import pandas as pd
Example 1 manual
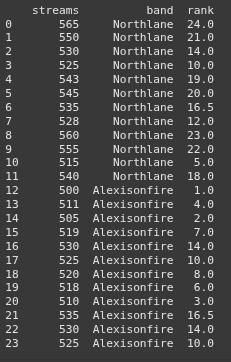
					# Monthly stream counts (in thousands) for Northlane and Alexisonfire over 12 months
northlane_streams = np.array([565, 550, 530, 525, 543, 545, 535, 528, 560, 555, 515, 540])
alexisonfire_streams = np.array([500, 511, 505, 519, 530, 525, 520, 518, 510, 535, 530, 525])
					# Combine data into a DataFrame for easier manipulation
data = pd.DataFrame({
    "streams": np.concatenate([northlane_streams, alexisonfire_streams]),
    "band": ["Northlane"] * len(northlane_streams) + ["Alexisonfire"] * len(alexisonfire_streams)
})
					# Rank the combined data
data['rank'] = data['streams'].rank(method='average')
					# Separate ranks for each band
northlane_ranks = data[data['band'] == 'Northlane']['rank'].values
alexisonfire_ranks = data[data['band'] == 'Alexisonfire']['rank'].values
					# Display the ranked data
print(data)
					# Sum of ranks for each group
R_northlane = northlane_ranks.sum()
R_alexisonfire = alexisonfire_ranks.sum()
					print(f"Sum of ranks for Northlane: {R_northlane}")
print(f"Sum of ranks for Alexisonfire: {R_alexisonfire}")
					# Number of observations in each group
n_northlane = len(northlane_streams)
n_alexisonfire = len(alexisonfire_streams)
					# Calculate U for each group
U_northlane = R_northlane - (n_northlane * (n_northlane + 1)) / 2
U_alexisonfire = R_alexisonfire - (n_alexisonfire * (n_alexisonfire + 1)) / 2
					print(f"U statistic for Northlane: {U_northlane}")
print(f"U statistic for Alexisonfire: {U_alexisonfire}")
					# Select the smaller U statistic
U_statistic = min(U_northlane, U_alexisonfire)
					# Perform the Mann-Whitney U Test for comparison
stat, p_value = mannwhitneyu(northlane_streams, alexisonfire_streams, alternative='two-sided')
print(p_value)
					# Interpretation
if p_value < 0.05:
    print("There is a significant difference in music streams between the two bands.")
else:
    print("There is no significant difference in music streams between the two bands.")
Example 2
					# Satisfaction scores for two stores
store_1_scores = np.array([82, 85, 87, 88, 90])
store_2_scores = np.array([84, 86, 89, 91, 92])
					# Running the Mann-Whitney U Test
stat, p_value = mannwhitneyu(store_1_scores, store_2_scores, alternative='two-sided')
print(f"Mann-Whitney U statistic: {stat}")
print(f"P-value: {p_value}")
					# Interpretation
if p_value < 0.05:
    print("There is a significant difference in customer satisfaction between the two stores.")
else:
    print("There is no significant difference in customer satisfaction between the two stores.")
Example 3 Tail Direction
					# Batting averages for Player X and Player Y over 15 seasons
player_X_averages = np.array([0.210, 0.300, 0.320, 0.335, 0.210, 0.205, 0.255, 0.290, 0.285, 0.300, 0.305, 0.310, 0.275, 0.295, 0.120])
player_Y_averages = np.array([0.250, 0.210, 0.290, 0.225, 0.275, 0.275, 0.280, 0.258, 0.362, 0.268, 0.255, 0.260, 0.265, 0.270, 0.258])
stat, shapiro_p_value_player_x = shapiro(player_X_averages)
print(shapiro_p_value_player_x)
stat, shapiro_p_value_player_y = shapiro(player_Y_averages)
print(shapiro_p_value_player_y)
					# Perform the Mann-Whitney U Test
stat, p_value = mannwhitneyu(player_X_averages, player_Y_averages, alternative='greater')
					print(f"Mann-Whitney U statistic: {stat}")
print(f"P-value: {p_value}")
					# Interpretation
if p_value < 0.05:
    print("There is a significant difference in batting averages between the two players.")
else:
    print("There is no significant difference in batting averages between the two players.")
