Logistic Regression
Logistic regression is a statistical model used for binary classification problems, where the goal is to predict one of two possible outcomes. Unlike linear regression, which predicts continuous values, logistic regression estimates the probability that a given input belongs to a particular class. It uses the logistic (sigmoid) function to map predicted values between 0 and 1, making it ideal for determining class membership. This method is widely used in fields like medical diagnosis, marketing, and social sciences for its simplicity and effectiveness.
import pandas as pd
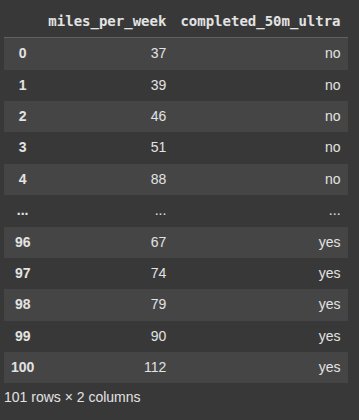
This dictionary contains data on individuals’ weekly running mileage (miles_per_week) and whether they have completed a 50-mile ultramarathon (completed_50m_ultra), with responses as “yes” or “no”.
					d = {'miles_per_week': [37,39,46,51,88,17,18,20,21,22,23,24,25,27,28,29,30,31,32,33,34,38,40,42,57,68,35,36,41,43,45,47,49,50,52,53,54,55,56,58,59,60,61,63,64,65,66,69,70,72,73,75,76,77,78,80,81,82,83,84,85,86,87,89,91,92,93,95,96,97,98,99,100,101,102,103,104,105,106,107,109,110,111,113,114,115,116,116,118,119,120,121,123,124,126,62,67,74,79,90,112],
      'completed_50m_ultra': ['no','no','no','no','no','no','no','no','no','no','no','no','no','no','no','no','no','no','no','no','no','no','no','no','no','no','yes','yes','yes','yes','no','yes','yes','yes','no','yes','yes','yes','yes','yes','yes','yes','yes','no','yes','yes','yes','yes','yes','yes','yes','no','yes','yes','yes','yes','yes','yes','yes','no','yes','yes','yes','yes','yes','yes','yes','no','yes','yes','yes','yes','yes','yes','yes','yes','yes','yes','yes','yes','yes','yes','yes','yes','yes','yes','yes','yes','yes','yes','yes','yes','yes','yes','yes','yes','yes','yes','yes','yes','yes',]}
Next we create a pandas DataFrame from d
df = pd.DataFrame(data=d)
Here we import Ordinal Encoder class from Sklearn to convert categori al features, meaning we are converting strings into integer values to make it easier for our model to utilize.
from sklearn.preprocessing import OrdinalEncoder
finished_race = ['no', 'yes']
enc = OrdinalEncoder(categories = [finished_race])
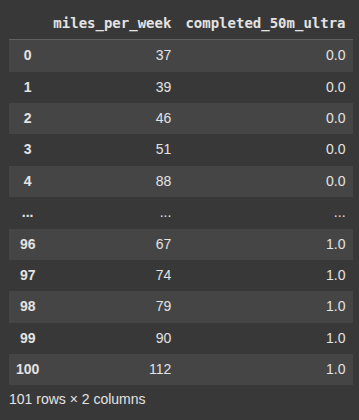
Here we transform the ‘competed_50m_ultra’ from string to numeric codes
df['completed_50m_ultra'] = enc.fit_transform(df[['completed_50m_ultra']])
from matplotlib import pyplot as plt
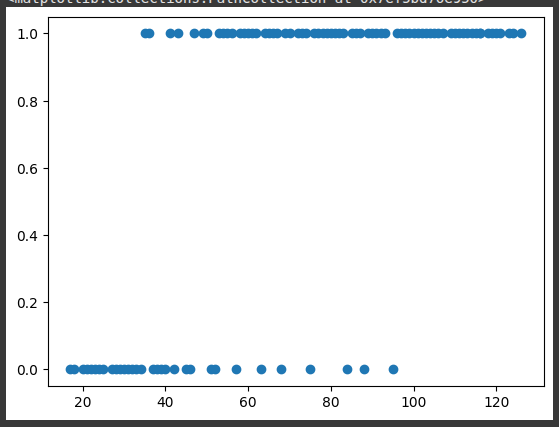
creates a scatter plot using matplotlib.pyplot, where:
x-axisshows themiles_per_week(numerical values).y-axisshows the encoded values ofcompleted_50m_ultra.
plt.scatter(df.miles_per_week,df.completed_50m_ultra)
import seaborn as sns
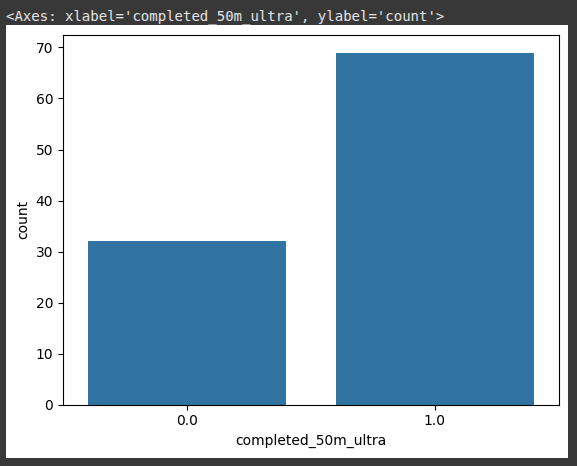
This uses Seaborn to create a count plot, which shows the number of occurrences of each category in the completed_50m_ultra column.
sns.countplot(x= 'completed_50m_ultra',data=df)
This selects the first column of the DataFrame df and assign it to X
X = df.iloc[:, 0:1]
Here we select the second column of the DataFrame df.
y = df.iloc[:,1]
This is used to split the data set into training and testing sets,
from sklearn.model_selection import train_test_split
X_train, X_test, y_train, y_test = train_test_split(X, y,train_size=0.8, random_state=11)
Here we check the dimension of X_train
X_train.shape
Here we also check the dim of the X_test.
X_test.shape
from sklearn.linear_model import LogisticRegression
We import LogisticRegression.
model = LogisticRegression()
we use the .fit() to train the model.
model.fit(X_train, y_train)
We also evaluate(test) the model using the .predict()
y_pred = model.predict(X_test)
This returns the accuracy of the trained model on the test set.
model.score(X_test,y_test)
Here we import the confusion_marix to evaluate classifcation model performance.
from sklearn.metrics import confusion_matrix
print(confusion_matrix(y_test, y_pred))
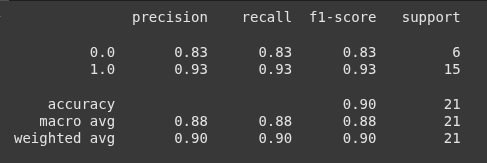
Here we import the classification_report function and it is used to generate a text summary of key classification metrics such as:
precision,
Recall,
F1-score,
Support
from sklearn.metrics import classification_report
print(classification_report(y_test, y_pred))
Ryan is a Data Scientist at a fintech company, where he focuses on fraud prevention in underwriting and risk. Before that, he worked as a Data Analyst at a tax software company. He holds a degree in Electrical Engineering from UCF.