Law of Large Numbers Python
					import numpy as np
import matplotlib.pyplot as plt
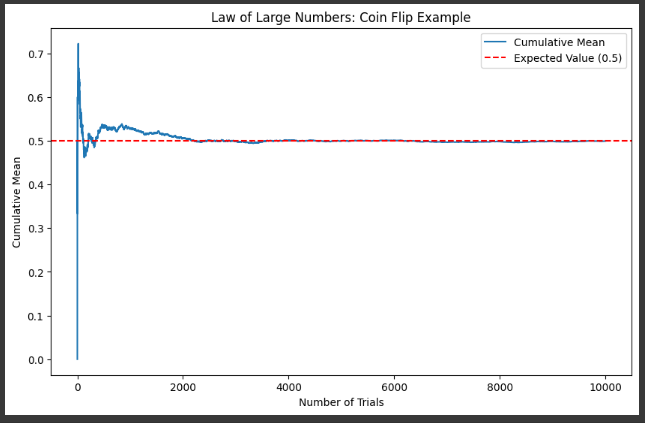
Example 1 Coin Flips (Bernoulli Distribution)
#If we repeat the coin flip multiple times, the sum of these Bernoulli trials follows a
#Binomial distribution. However, when looking at a single flip, it’s simply a Bernoulli distribution
np.random.seed(15) # For reproducibility
					# Number of trials (coin flips)
n_trials = 10000
					# Simulate coin flips
coin_flips = np.random.randint(0, 2, size=n_trials)
print(coin_flips)
					# Calculate cumulative mean
cumulative_mean = np.cumsum(coin_flips) / (np.arange(1, n_trials + 1))
print(cumulative_mean)
					plt.figure(figsize=(10, 6))
plt.plot(cumulative_mean, label='Cumulative Mean')
plt.axhline(y=0.5, color='r', linestyle='--', label='Expected Value (0.5)')
plt.xlabel('Number of Trials')
plt.ylabel('Cumulative Mean')
plt.title('Law of Large Numbers: Coin Flip Example')
plt.legend()
plt.show()

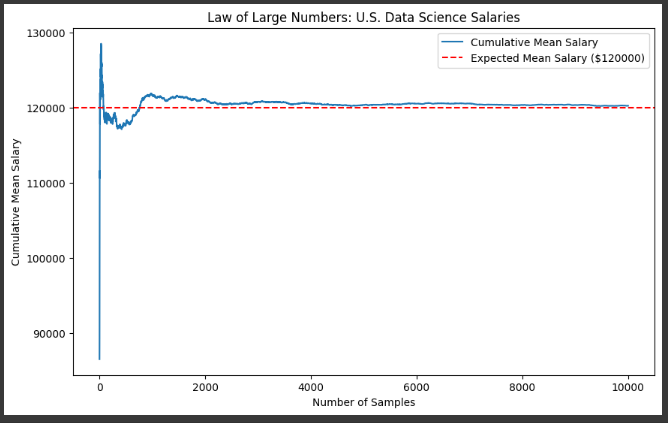
Example 2 Data Science Salaries (Normal Distribution)
					# Number of samples (salaries)
n_samples = 10000
					# Parameters of the salary distribution
mu = 120000  # Mean salary
sigma = 30000 # Standard deviation
					# Generate random samples of salaries
salaries = np.random.normal(mu, sigma, n_samples)
print(salaries)
					# Calculate cumulative mean
cumulative_mean_salaries = np.cumsum(salaries) / (np.arange(1, n_samples + 1))
print(cumulative_mean_salaries)
					plt.figure(figsize=(10, 6))
plt.plot(cumulative_mean_salaries, label='Cumulative Mean Salary')
plt.axhline(y=mu, color='r', linestyle='--', label=f'Expected Mean Salary (${mu})')
plt.xlabel('Number of Samples')
plt.ylabel('Cumulative Mean Salary')
plt.title('Law of Large Numbers: U.S. Data Science Salaries')
plt.legend()
plt.show()

Ryan is a Data Scientist at a fintech company, where he focuses on fraud prevention in underwriting and risk. Before that, he worked as a Data Analyst at a tax software company. He holds a degree in Electrical Engineering from UCF.
