Kaggle House price prediction Regression Analysis

				
					import pandas as pd
import numpy as np
from scipy import stats
from sklearn.metrics import mean_squared_error

import matplotlib.pyplot as plt
import seaborn as sns

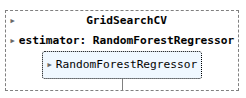
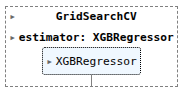
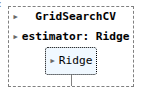
from sklearn.model_selection import train_test_split, GridSearchCV, cross_val_score
from sklearn.compose import make_column_transformer, ColumnTransformer
from sklearn.pipeline import Pipeline, make_pipeline
from sklearn.impute import SimpleImputer
from sklearn.preprocessing import OrdinalEncoder, StandardScaler, OneHotEncoder

from sklearn.linear_model import LinearRegression, Ridge
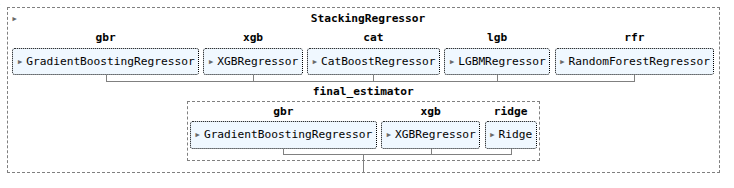
from sklearn.ensemble import RandomForestRegressor, GradientBoostingRegressor, VotingRegressor, StackingRegressor
from xgboost import XGBRegressor
from catboost import CatBoostRegressor
import lightgbm as lgb


					train_df = pd.read_csv('/kaggle/input/house-prices-advanced-regression-techniques/train.csv')
test_df = pd.read_csv('/kaggle/input/house-prices-advanced-regression-techniques/test.csv')


					train_df.columns


					train_df.describe()


					train_df.dtypes[train_df.dtypes != 'object']


					plt.scatter(x='MSSubClass', y='SalePrice', data=train_df)


					plt.scatter(x='LotFrontage', y='SalePrice', data=train_df)


					train_df.query('LotFrontage > 300')
#Drop 935, 1299


					stats.zscore(train_df['LotArea']).sort_values().tail(10)


					plt.scatter(x='OverallQual', y='SalePrice', data=train_df)


					train_df.query('OverallQual == 10')
#maybe 524


					plt.scatter(x='OverallCond', y='SalePrice', data=train_df)


					train_df.query('OverallCond == 2')
#379


					train_df.query('OverallCond == 5 & SalePrice > 700000')
#1183


					train_df.query('OverallCond == 6 & SalePrice > 700000')
#692


					plt.scatter(x='YearBuilt', y='SalePrice', data=train_df)


					train_df.query('YearBuilt < 1900 & SalePrice > 400000')
#186


					plt.scatter(x='YearRemodAdd', y='SalePrice', data=train_df)


					train_df.query('YearRemodAdd < 1970 & SalePrice > 300000')
#314


					plt.scatter(x='MasVnrArea', y='SalePrice', data=train_df)


					train_df.query('MasVnrArea > 1500')
#298


					plt.scatter(x='BsmtFinSF1', y='SalePrice', data=train_df)


					train_df.query('BsmtFinSF1 > 5000')
#1299


					plt.scatter(x='BsmtFinSF2', y='SalePrice', data=train_df)


					train_df.query('BsmtFinSF2 > 400 & SalePrice > 500000')
#441


					plt.scatter(x='BsmtUnfSF', y='SalePrice', data=train_df)


					plt.scatter(x='TotalBsmtSF', y='SalePrice', data=train_df)


					train_df.query('TotalBsmtSF > 5000')
#1299


					plt.scatter(x='1stFlrSF', y='SalePrice', data=train_df)


					plt.scatter(x='2ndFlrSF', y='SalePrice', data=train_df)


					plt.scatter(x='LowQualFinSF', y='SalePrice', data=train_df)


					train_df.query('LowQualFinSF > 500')
#186


					plt.scatter(x='GrLivArea', y='SalePrice', data=train_df)


					train_df.query('GrLivArea > 4400')
#524, 1299


					plt.scatter(x='BsmtFullBath', y='SalePrice', data=train_df)


					train_df.query('BsmtFullBath == 3')
#739


					plt.scatter(x='BsmtHalfBath', y='SalePrice', data=train_df)


					stats.zscore(train_df['BsmtHalfBath']).unique()


					train_df.query('BsmtHalfBath == 2')
#598, 955


					plt.scatter(x='FullBath', y='SalePrice', data=train_df)


					plt.scatter(x='HalfBath', y='SalePrice', data=train_df)


					lt.scatter(x='BedroomAbvGr', y='SalePrice', data=train_df)


					train_df.query('BedroomAbvGr == 8')
#636


					plt.scatter(x='KitchenAbvGr', y='SalePrice', data=train_df)


					train_df.query('KitchenAbvGr == 3')
#49, 810


					plt.scatter(x='TotRmsAbvGrd', y='SalePrice', data=train_df)


					train_df.query('TotRmsAbvGrd == 14')
#636


					plt.scatter(x='Fireplaces', y='SalePrice', data=train_df)


					plt.scatter(x='GarageYrBlt', y='SalePrice', data=train_df)


					plt.scatter(x='GarageCars', y='SalePrice', data=train_df)


					plt.scatter(x='GarageArea', y='SalePrice', data=train_df)


					train_df.query('GarageArea > 1200')
#1062, 1191


					plt.scatter(x='WoodDeckSF', y='SalePrice', data=train_df)


					plt.scatter(x='OpenPorchSF', y='SalePrice', data=train_df)


					train_df.query('OpenPorchSF > 500')
#496


					plt.scatter(x='EnclosedPorch', y='SalePrice', data=train_df)


					train_df.query('EnclosedPorch > 500')
#198


					plt.scatter(x='3SsnPorch', y='SalePrice', data=train_df)


					plt.scatter(x='ScreenPorch', y='SalePrice', data=train_df)


					plt.scatter(x='PoolArea', y='SalePrice', data=train_df)


					values = [598, 955, 935, 1299, 250, 314, 336, 707, 379, 1183, 692, 186, 441, 186, 524, 739, 598, 955, 636, 1062, 1191, 496, 198, 1338]


					train_df = train_df[train_df.Id.isin(values) == False]


					pd.DataFrame(train_df.isnull().sum().sort_values(ascending=False)).head(20)


					train_df['MiscFeature'].unique()


					train_df['Alley'].unique()


					train_df['Alley'].fillna('No', inplace=True)
test_df['Alley'].fillna('No', inplace=True)


					sns.catplot(data=train_df, x="Alley", y="SalePrice", kind="box")


					train_df['Fence'].unique()


					train_df['Fence'].fillna('No', inplace=True)
test_df['Fence'].fillna('No', inplace=True)


					sns.catplot(data=train_df, x="Fence", y="SalePrice", kind="box")


					train_df['MasVnrType'].unique()


					train_df['MasVnrType'].fillna('No', inplace=True)
test_df['MasVnrType'].fillna('No', inplace=True)


					sns.catplot(data=train_df, x="MasVnrType", y="SalePrice", kind="box")


					train_df['MasVnrArea'].fillna(0, inplace=True)
test_df['MasVnrArea'].fillna(0, inplace=True)


					train_df['FireplaceQu'].unique()


					train_df['FireplaceQu'].fillna('No', inplace=True)
test_df['FireplaceQu'].fillna('No', inplace=True)


					sns.catplot(data=train_df, x="FireplaceQu", y="SalePrice", kind="box")


					sns.catplot(data=train_df, x="Fireplaces", y="SalePrice", kind="box")


					train_df['LotFrontage'].fillna(0, inplace=True)
test_df['LotFrontage'].fillna(0, inplace=True)


					train_df['GarageYrBlt'].corr(train_df['YearBuilt'])


					train_df['GarageCond'].unique()


					train_df['GarageCond'].fillna('No', inplace=True)
test_df['GarageCond'].fillna('No', inplace=True)


					sns.catplot(data=train_df, x="GarageCond", y="SalePrice", kind="box")


					train_df['GarageType'].fillna('No', inplace=True)
test_df['GarageType'].fillna('No', inplace=True)


					sns.catplot(data=train_df, x="GarageType", y="SalePrice", kind="box")


					train_df['GarageFinish'].fillna('No', inplace=True)
test_df['GarageFinish'].fillna('No', inplace=True)


					sns.catplot(data=train_df, x="GarageFinish", y="SalePrice", kind="box")


					train_df['GarageQual'].fillna('No', inplace=True)
test_df['GarageQual'].fillna('No', inplace=True)


					sns.catplot(data=train_df, x="GarageQual", y="SalePrice", kind="box")


					train_df['BsmtFinType2'].unique()


					train_df['BsmtFinType2'].fillna('Unf', inplace=True)
test_df['BsmtFinType2'].fillna('Unf', inplace=True)


					sns.catplot(data=train_df, x="BsmtFinType2", y="SalePrice", kind="box")


					train_df['BsmtExposure'].unique()


					train_df['BsmtExposure'].fillna('No', inplace=True)
test_df['BsmtExposure'].fillna('No', inplace=True)


					sns.catplot(data=train_df, x="BsmtExposure", y="SalePrice", kind="box")


					train_df['BsmtQual'].unique()


					train_df['BsmtQual'].fillna('No', inplace=True)
test_df['BsmtQual'].fillna('No', inplace=True)


					sns.catplot(data=train_df, x="BsmtQual", y="SalePrice", kind="box")


					train_df['BsmtCond'].unique()


					train_df['BsmtCond'].fillna('No', inplace=True)
test_df['BsmtCond'].fillna('No', inplace=True)


					sns.catplot(data=train_df, x="BsmtCond", y="SalePrice", kind="box")


					train_df['BsmtFinType1'].unique()


					train_df['BsmtFinType1'].fillna('Unf', inplace=True)
test_df['BsmtFinType1'].fillna('Unf', inplace=True)


					sns.catplot(data=train_df, x="BsmtFinType1", y="SalePrice", kind="box")


					train_df['MasVnrArea'].fillna(0, inplace=True)
test_df['MasVnrArea'].fillna(0, inplace=True)


					train_df['Electrical'].fillna('SBrkr', inplace=True)
test_df['Electrical'].fillna('SBrkr', inplace=True)


					train_df = train_df.drop(columns=['PoolQC', 'MiscFeature', 'Alley', 'Fence', 'GarageYrBlt', 'GarageCond', 'BsmtFinType2'])
test_df = test_df.drop(columns=['PoolQC', 'MiscFeature', 'Alley', 'Fence', 'GarageYrBlt', 'GarageCond', 'BsmtFinType2'])


train_df = train_df.drop(columns=['PoolQC', 'MiscFeature', 'Alley', 'Fence', 'GarageYrBlt', 'GarageCond', 'BsmtFinType2'])
test_df = test_df.drop(columns=['PoolQC', 'MiscFeature', 'Alley', 'Fence', 'GarageYrBlt', 'GarageCond', 'BsmtFinType2'])
 
				
					train_df['houseage'] = train_df['YrSold'] - train_df['YearBuilt']
test_df['houseage'] = test_df['YrSold'] - test_df['YearBuilt']


					train_df['houseremodelage'] = train_df['YrSold'] - train_df['YearRemodAdd']
test_df['houseremodelage'] = test_df['YrSold'] - test_df['YearRemodAdd']


					train_df['totalsf'] = train_df['1stFlrSF'] + train_df['2ndFlrSF'] + train_df['BsmtFinSF1'] + train_df['BsmtFinSF2']
test_df['totalsf'] = test_df['1stFlrSF'] + test_df['2ndFlrSF'] + test_df['BsmtFinSF1'] + test_df['BsmtFinSF2']


					train_df['totalarea'] = train_df['GrLivArea'] + train_df['TotalBsmtSF']
test_df['totalarea'] = test_df['GrLivArea'] + test_df['TotalBsmtSF']


					train_df['totalbaths'] = train_df['BsmtFullBath'] + train_df['FullBath'] + 0.5 * (train_df['BsmtHalfBath'] + train_df['HalfBath']) 
test_df['totalbaths'] = test_df['BsmtFullBath'] + test_df['FullBath'] + 0.5 * (test_df['BsmtHalfBath'] + test_df['HalfBath']) 


					train_df['totalporchsf'] = train_df['OpenPorchSF'] + train_df['3SsnPorch'] + train_df['EnclosedPorch'] + train_df['ScreenPorch'] + train_df['WoodDeckSF']
test_df['totalporchsf'] = test_df['OpenPorchSF'] + test_df['3SsnPorch'] + test_df['EnclosedPorch'] + test_df['ScreenPorch'] + test_df['WoodDeckSF']


					train_df = train_df.drop(columns=['Id','YrSold', 'YearBuilt', 'YearRemodAdd', '1stFlrSF', '2ndFlrSF', 'BsmtFinSF1', 'BsmtFinSF2', 'GrLivArea', 'TotalBsmtSF','BsmtFullBath', 'FullBath', 'BsmtHalfBath', 'HalfBath', 'OpenPorchSF', '3SsnPorch', 'EnclosedPorch', 'ScreenPorch','WoodDeckSF'])
test_df = test_df.drop(columns=['YrSold', 'YearBuilt', 'YearRemodAdd', '1stFlrSF', '2ndFlrSF', 'BsmtFinSF1', 'BsmtFinSF2', 'GrLivArea', 'TotalBsmtSF','BsmtFullBath', 'FullBath', 'BsmtHalfBath', 'HalfBath', 'OpenPorchSF', '3SsnPorch', 'EnclosedPorch', 'ScreenPorch','WoodDeckSF'])


					correlation_matrix = train_df.corr(numeric_only=True)
plt.figure(figsize=(20,12))
sns.heatmap(correlation_matrix, annot=True, cmap='coolwarm', fmt=".2f")
				
			
#drop GarageArea or GarageCars
				
					train_df = train_df.drop(columns=['GarageArea'])
test_df = test_df.drop(columns=['GarageArea'])


					sns.histplot(
    train_df,
    x=train_df['SalePrice']
)


					train_df['SalePrice'] = np.log1p(train_df['SalePrice'])


					sns.histplot(
    train_df,
    x=train_df['SalePrice']
)


					train_df.dtypes[train_df.dtypes=='object']


					train_df.dtypes[train_df.dtypes !='object']


					ode_cols = ['LotShape', 'LandContour','Utilities','LandSlope',  'BsmtQual',  'BsmtFinType1',  'CentralAir',  'Functional', \
           'FireplaceQu', 'GarageFinish', 'GarageQual', 'PavedDrive', 'ExterCond', 'KitchenQual', 'BsmtExposure', 'HeatingQC','ExterQual', 'BsmtCond']


					ohe_cols = ['Street', 'LotConfig','Neighborhood', 'Condition1', 'Condition2', 'BldgType', 'HouseStyle', 'RoofStyle', 'Exterior1st', 'Exterior2nd', \
           'MasVnrType','Foundation',  'Electrical',  'SaleType', 'MSZoning', 'SaleCondition', 'Heating', 'GarageType', 'RoofMatl']


					num_cols = train_df.select_dtypes(include=['int64', 'float64']).columns
num_cols = num_cols.drop('SalePrice')


					num_pipeline = Pipeline(steps=[
    ('impute', SimpleImputer(strategy='mean')),
    ('scaler', StandardScaler())
])


					ode_pipeline = Pipeline(steps=[
    ('impute', SimpleImputer(strategy='most_frequent')),
    ('ode', OrdinalEncoder(handle_unknown='use_encoded_value', unknown_value=-1))
])


					ohe_pipeline = Pipeline(steps=[
    ('impute', SimpleImputer(strategy='most_frequent')),
    ('ohe', OneHotEncoder(handle_unknown='ignore', sparse_output=False))
])


					col_trans = ColumnTransformer(transformers=[
    ('num_p', num_pipeline, num_cols),
    ('ode_p', ode_pipeline, ode_cols),
    ('ohe_p', ohe_pipeline, ohe_cols),
    ],
    remainder='passthrough', 
    n_jobs=-1)


					pipeline = Pipeline(steps=[
    ('preprocessing', col_trans)
])


					X = train_df.drop('SalePrice', axis=1)
y = train_df['SalePrice']


					X_preprocessed = pipeline.fit_transform(X)


					X_train, X_test, y_train, y_test = train_test_split(X_preprocessed, y, test_size=0.2, random_state=25)
				
			
#build models
				
					lr = LinearRegression()


					lr.fit(X_train, y_train)


					y_pred_lr = lr.predict(X_test)


					mean_squared_error(y_test, y_pred_lr)


					RFR = RandomForestRegressor(random_state=13)


					param_grid_RFR = {
    'max_depth': [5, 10, 15],
    'n_estimators': [100, 250, 500],
    'min_samples_split': [3, 5, 10]
}


					rfr_cv = GridSearchCV(RFR, param_grid_RFR, cv=5, scoring='neg_mean_squared_error', n_jobs=-1)


					rfr_cv.fit(X_train, y_train)


					np.sqrt(-1 * rfr_cv.best_score_)


					rfr_cv.best_params_


					XGB = XGBRegressor(random_state=13)


					param_grid_XGB = {
    'learning_rate': [0.05, 0.1, 0.2],
    'n_estimators': [300],
    'max_depth': [3],
    'min_child_weight': [1,2,3],
    'gamma': [0, 0.1, 0.2],
    'subsample': [0.8, 0.9, 1.0],
    'colsample_bytree': [0.8, 0.9, 1.0],
}


					xgb_cv = GridSearchCV(XGB, param_grid_XGB, cv=3, scoring='neg_mean_squared_error', n_jobs=-1)


					xgb_cv.fit(X_train, y_train)


					np.sqrt(-1 * xgb_cv.best_score_)


					ridge = Ridge()


					param_grid_ridge = {
    'alpha': [0.05, 0.1, 1, 3, 5, 10],
    'solver': ['auto', 'svd', 'cholesky', 'lsqr', 'sparse_cg', 'sag']
}


					ridge_cv = GridSearchCV(ridge, param_grid_ridge, cv=5, scoring='neg_mean_squared_error', n_jobs=-1)


					ridge_cv.fit(X_train, y_train)


					np.sqrt(-1 * ridge_cv.best_score_)


					GBR = GradientBoostingRegressor()


					param_grid_GBR = {
    'max_depth': [12, 15, 20],
    'n_estimators': [200, 300, 1000],
    'min_samples_leaf': [10, 25, 50],
    'learning_rate': [0.001, 0.01, 0.1],
    'max_features': [0.01, 0.1, 0.7]
}


					GBR_cv = GridSearchCV(GBR, param_grid_GBR, cv=5, scoring='neg_mean_squared_error', n_jobs=-1)


					GBR_cv.fit(X_train, y_train)


					np.sqrt(-1 * GBR_cv.best_score_)


					lgbm_regressor = lgb.LGBMRegressor()


					param_grid_lgbm = {
    'boosting_type': ['gbdt', 'dart'],
    'num_leaves': [20, 30, 40],
    'learning_rate': [0.01, 0.05, 0.1],
    'n_estimators': [100, 200, 300]
}


					lgbm_cv = GridSearchCV(lgbm_regressor, param_grid_lgbm, cv=3, scoring='neg_mean_squared_error', n_jobs=-1)


					lgbm_cv.fit(X_train, y_train)


					np.sqrt(-1 * lgbm_cv.best_score_)


catboost = CatBoostRegressor(loss_function='RMSE', verbose=False)


					param_grid_cat ={
    'iterations': [100, 500, 1000],
    'depth': [4, 6, 8, 10],
    'learning_rate': [0.01, 0.05, 0.1, 0.5]
}


					cat_cv = GridSearchCV(catboost, param_grid_cat, cv=3, scoring='neg_mean_squared_error', n_jobs=-1)


					cat_cv.fit(X_train, y_train)


					np.sqrt(-1 * cat_cv.best_score_)


					vr = VotingRegressor([('gbr', GBR_cv.best_estimator_),
                      ('xgb', xgb_cv.best_estimator_),
                      ('ridge', ridge_cv.best_estimator_)],
                    weights=[2,3,1])


					vr.fit(X_train, y_train)


					y_pred_vr = vr.predict(X_test)


					mean_squared_error(y_test, y_pred_vr, squared=False)


					estimators = [
    ('gbr', GBR_cv.best_estimator_),
    ('xgb', xgb_cv.best_estimator_),
    ('cat', cat_cv.best_estimator_),
    ('lgb', lgbm_cv.best_estimator_),
    ('rfr', rfr_cv.best_estimator_),
]


					stackreg = StackingRegressor(
            estimators = estimators,
            final_estimator = vr
)


					stackreg.fit(X_train, y_train)


					y_pred_stack = stackreg.predict(X_test)


					mean_squared_error(y_test, y_pred_stack, squared=False)


					df_test_preprocess = pipeline.transform(test_df)


					y_stacking = np.exp(stackreg.predict(df_test_preprocess))

df_y_stacking_out = test_df[['Id']]
df_y_stacking_out['SalePrice'] = y_stacking

df_y_stacking_out.to_csv('submission.csv', index=False)


Ryan is a Data Scientist at a fintech company, where he focuses on fraud prevention in underwriting and risk. Before that, he worked as a Data Analyst at a tax software company. He holds a degree in Electrical Engineering from UCF.

Leave a Reply

Your email address will not be published. Required fields are marked *