How to Scrape TikTok Data with n8n and Apify (No Code Required)
Want to pull TikTok account data and post metrics automatically — without writing a single line of code? In this tutorial we’ll build a complete n8n workflow that uses the Apify TikTok scraper actor to collect both account-level information (followers, hearts, bio) and individual post data (plays, shares, comments, hashtags), then filters for high-performing posts and writes everything to Google Sheets.
Whether you’re tracking competitors, doing affiliate research, monitoring your own accounts, or building a content intelligence pipeline, this workflow runs on autopilot and gives you structured TikTok data in a clean, queryable format.
The Apify TikTok actor costs just $4 per 1,000 results — and if you have a paid Apify account, you get $40 worth of free credits included. One workflow run typically costs just a few cents.
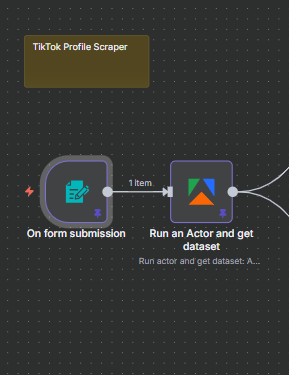
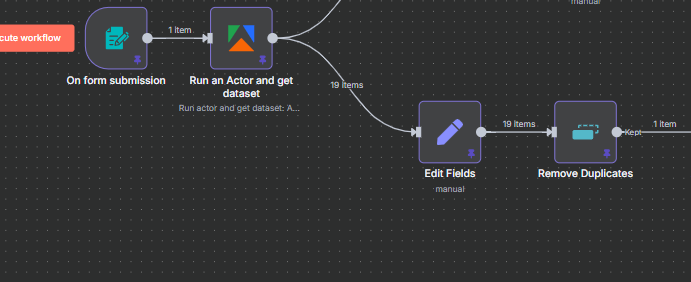
The Full Workflow Overview
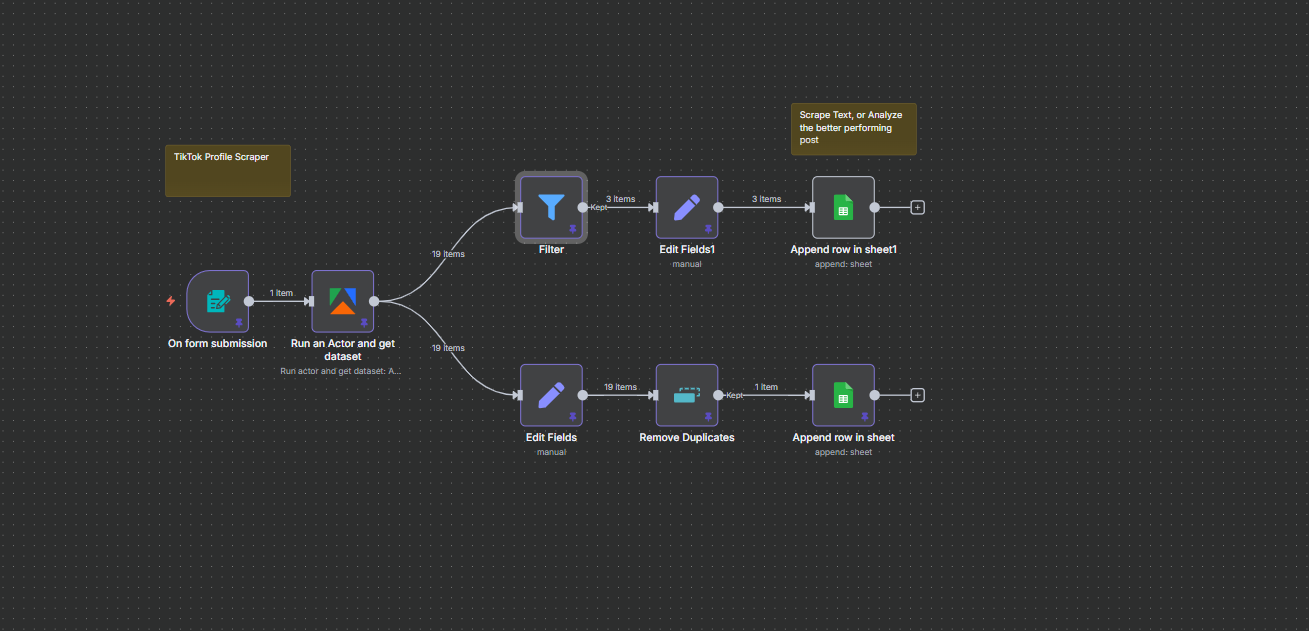
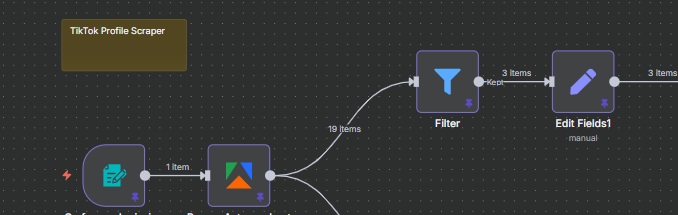
Before diving into each node, here’s the complete picture. The workflow is triggered by a form submission where you enter a TikTok username. Apify’s actor runs, pulling up to 19 posts and all account data for that profile. The data then splits into two branches:
- Branch 1 (Account Info): Extracts profile-level metrics, deduplicates, and writes one row to the Account Information tab of your Google Sheet
- Branch 2 (Posts): Filters posts by engagement criteria, extracts key metrics, cleans up the hashtags array, and appends high-performing posts to the Posts tab
The result is a two-tab Google Sheet that gives you a complete picture of any TikTok account — profile stats on one tab, their best-performing recent posts on the other. Let’s walk through how to build it.
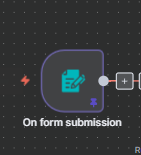
Step 1: Form Trigger — Enter the TikTok Username
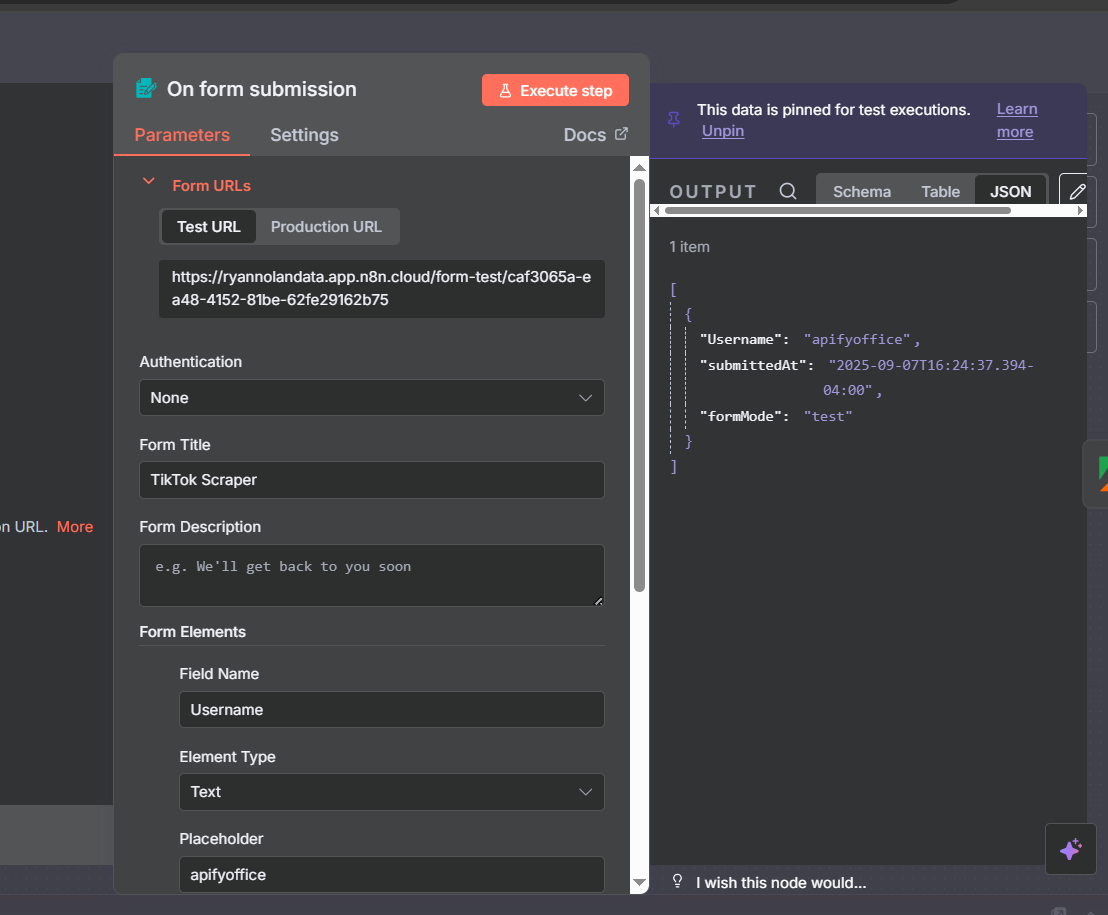
The workflow starts with an n8n Form Trigger. This gives you a simple web form where you type in the TikTok username you want to analyze and submit. It’s a clean, reusable interface — you can bookmark the form URL and use it whenever you want to profile a new account.
Set up the form with a single text field labeled Username. Add a placeholder (like apify) so the form is intuitive to use. When you submit the form, the username flows into the Apify node as a dynamic value.
For production setups, you can swap the Form Trigger for a Schedule Trigger to profile a fixed list of accounts automatically each day, or use a Webhook Trigger to integrate with other tools. But for testing and on-demand analysis, the form trigger is the simplest and most flexible approach.
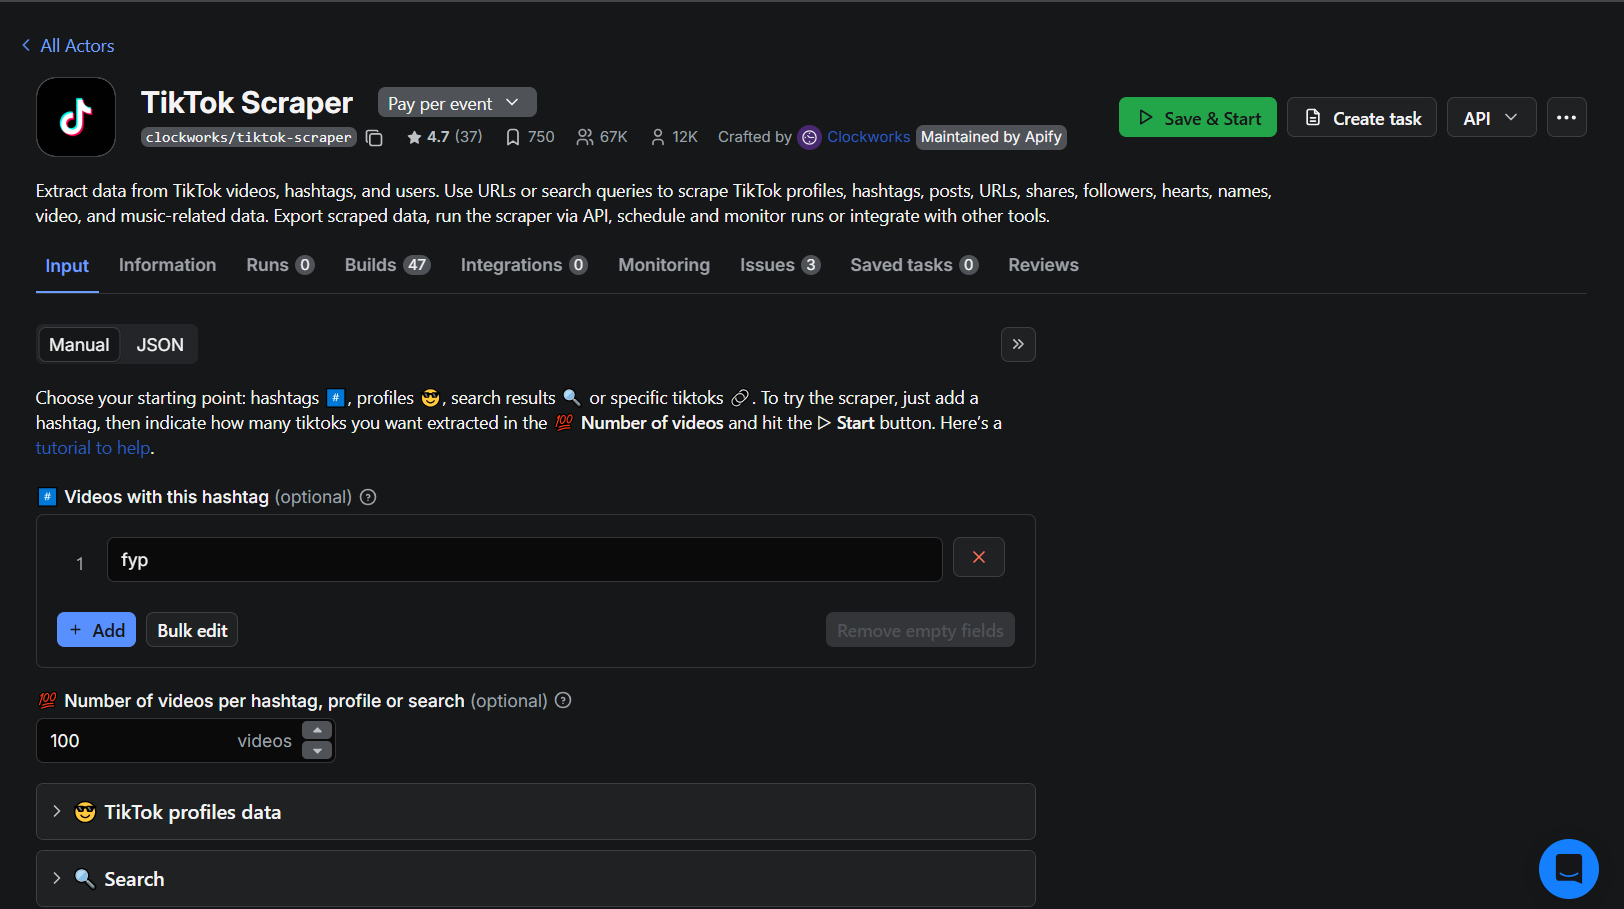
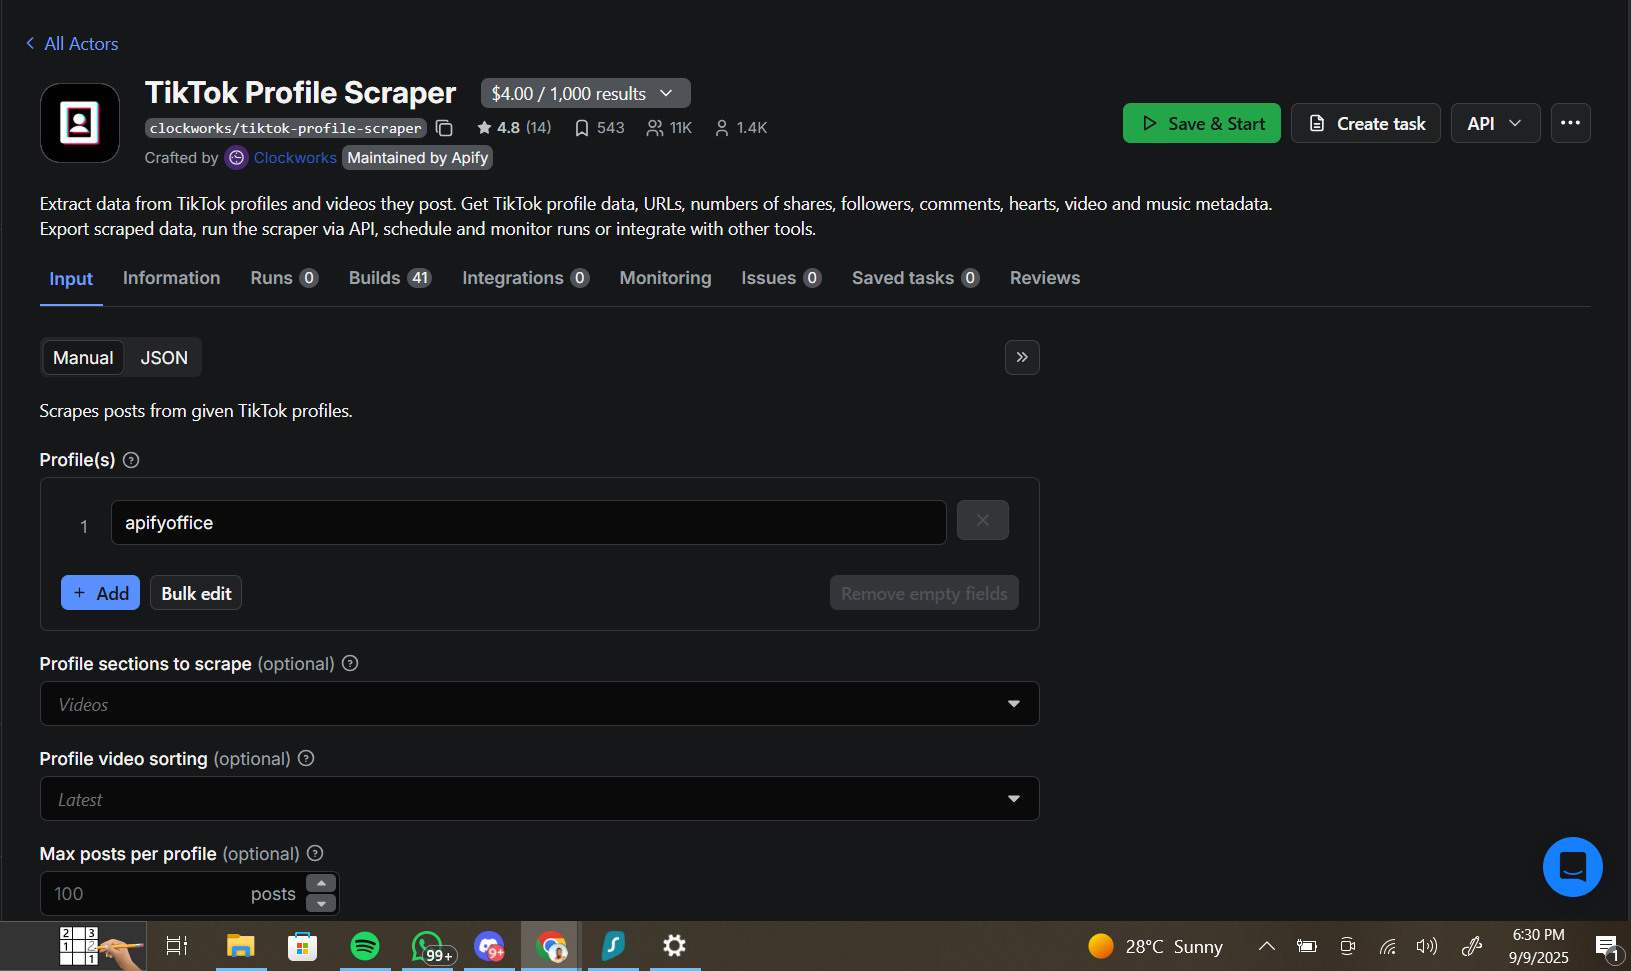
The Apify TikTok Scraper Actor
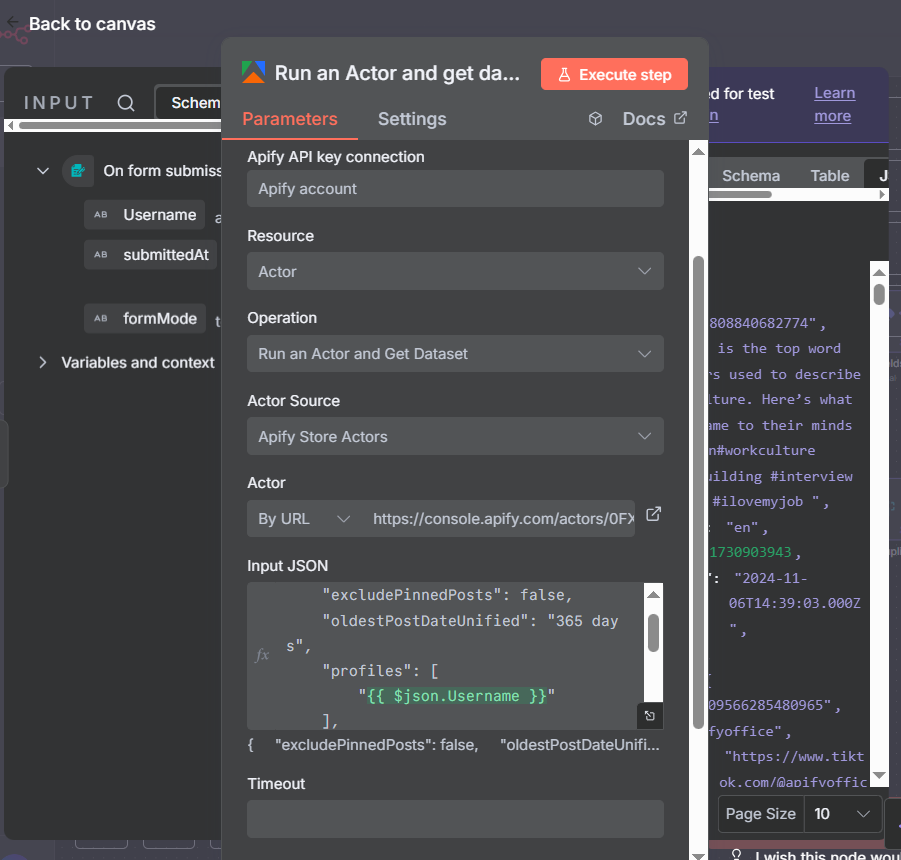
The second node is an Apify node using the “Run Actor and Get Dataset” operation — a combined action that launches the scraper and retrieves all results in a single step. In older versions of the Apify n8n node, this required either two separate nodes or an HTTP Request node. The updated community node handles it all in one.
The TikTok scraper actor pulls comprehensive data for any public TikTok profile:
- Account data: Profile URL, bio, following count, fans (followers), total hearts, video count
- Post data: Video URL, play count, share count, comment count, hashtags, publish date, description
Pricing is $4 per 1,000 results. A typical run pulling 20 posts from one account costs less than $0.10 in Apify platform credits. Paid Apify accounts ($40/month) include enough credits for hundreds of runs per month.
Connecting Apify to n8n
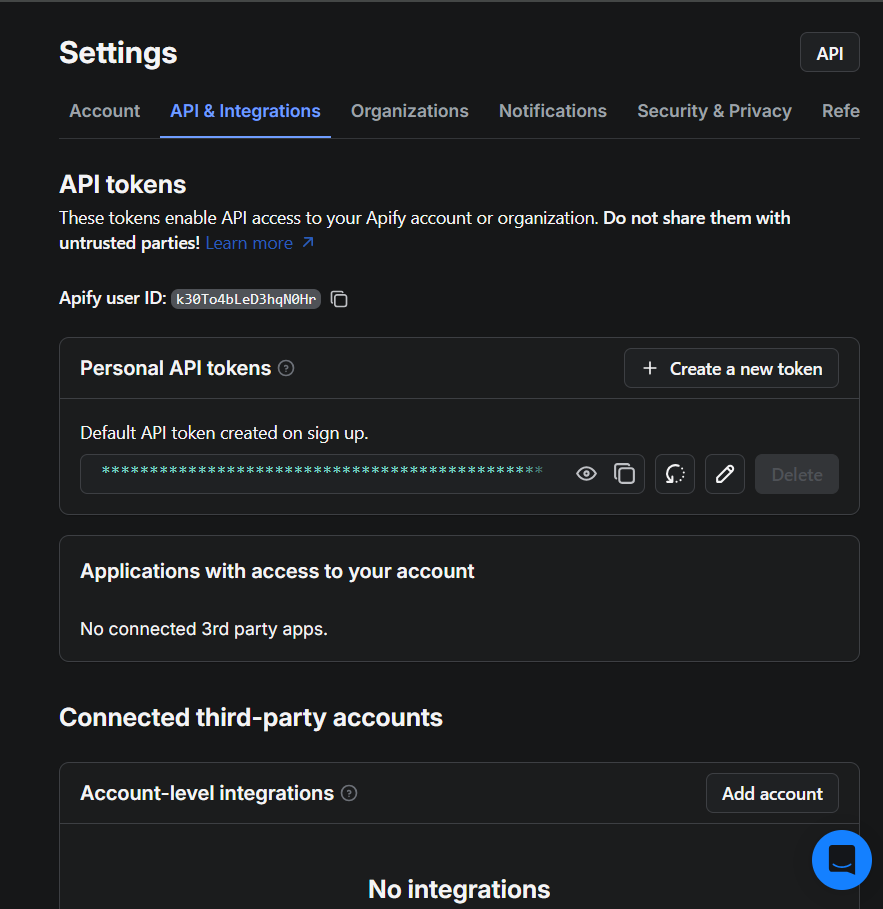
To use the Apify node you need to connect your Apify account. The setup takes about 30 seconds:
- Log into your Apify account and go to Settings → API & Integrations
- Copy your Personal API Token
- In n8n, open the Apify node, click Credentials, and paste the token in
Once the credential is saved, paste the TikTok actor’s ID into the Actor field. You get the actor ID from its URL on the Apify console — it follows the format username/actor-name.
OAuth2 authentication is also available for n8n Cloud users if you prefer a managed auth flow without manually handling API tokens.
After credentials are set, go to the Input section of the node. Rather than hardcoding a username, click JSON to enter the actor’s input in JSON format — this lets you inject dynamic values from the form trigger.
Configuring the Actor Input JSON
The TikTok scraper accepts a JSON input that controls what it scrapes. A good practice is to start from the actor’s example JSON on Apify, copy it into n8n, and then modify only the fields you need. Here’s the core configuration:
{
  "profiles": ["{{ $('Form Trigger').item.json.username }}"],
  "profilesType": "user",
  "videosPerPage": 20,
  "oldestPostDateDaysAgo": 365,
  "shouldDownloadVideos": false,
  "shouldDownloadCovers": false
}
Key settings to note:
- profiles: Pull the username from the form using an n8n expression —
{{ $('Form Trigger').item.json.username }}— so you never need to edit the node manually - videosPerPage: How many posts to retrieve per profile. Higher numbers cost more credits
- oldestPostDateDaysAgo: A relative date filter. Setting
365limits results to posts from the last year. You can also specify an absolute date string instead - shouldDownloadVideos/Covers: Keep these
falseunless you specifically need the video files — downloading media consumes significantly more credits
Advanced Actor Options — Profile Sections and Sorting
The TikTok scraper exposes a range of additional configuration options that let you fine-tune exactly what gets scraped. Here are the most useful ones:
profileSectionsToScrape: Choose between ["videos"] (standard posts) or ["reposts"] to pull reposted content instead. You can also scrape both.
videoSortingOrder: Set to latest (most recent first), popular (by play count), or oldest (oldest first). For competitor research, popular is usually most valuable — it surfaces the account’s best-performing content regardless of when it was posted.
maxPostsPerProfile: Hard cap on posts retrieved per account. Use this to control costs when profiling many accounts in sequence. If you only need the top 5 posts, set this to 5 and save credits.
Tip: You can expose any of these options as additional form fields, turning the form trigger into a full control panel for your scraping runs.
More Actor Options — Date Ranges and Engagement Filters
Two more configuration options worth highlighting — both related to filtering content before it even leaves Apify:
videosPublishedAfterDate / videosPublishedBeforeDate: Filter by an absolute date range. This is useful when managing ongoing monitoring — if you started tracking an account on January 1st, you can set that as the “after” date to only see new posts on each run.
videosWithMinNumberOfHearts / videosWithMinPlayCount: Pre-filter at the actor level to only retrieve posts meeting a minimum engagement threshold. This saves credits — you’re not pulling posts just to filter them out on the n8n side.
You can combine actor-level filtering (in the JSON input) with n8n-level filtering (a Filter node later in the workflow). Actor-level filtering is more cost-efficient; n8n-level filtering gives you more flexibility to adjust criteria without editing the actor configuration.
For the workflow in this tutorial, we use n8n-level filtering so you can see exactly how the Filter node works.
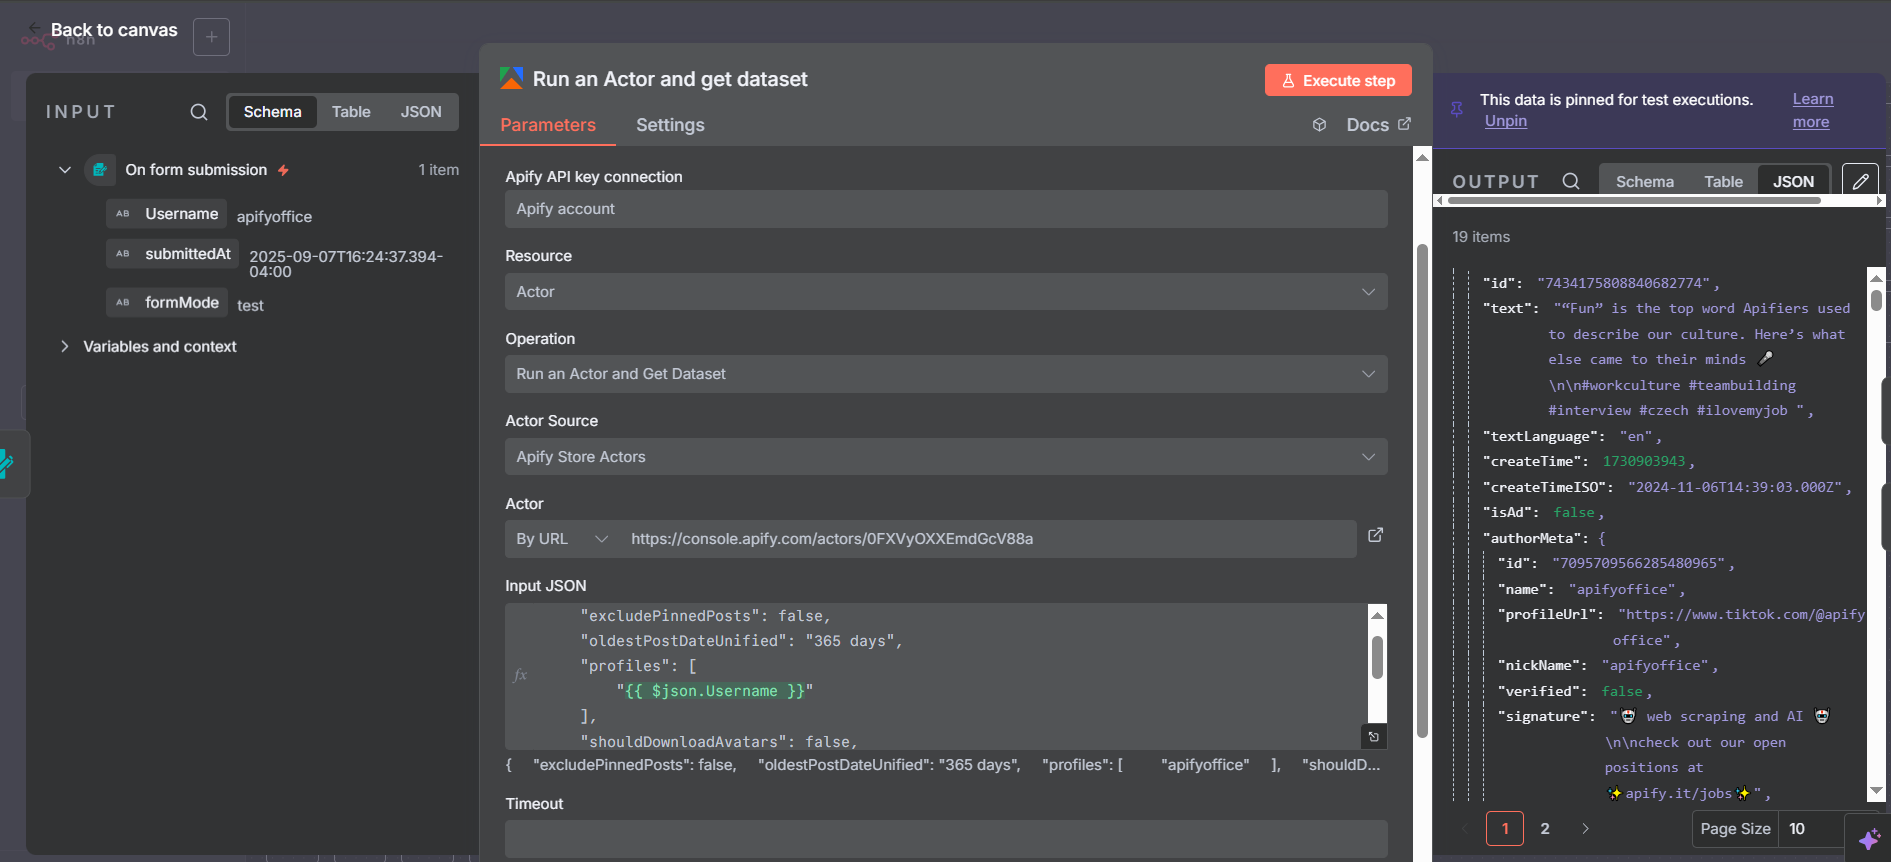
The Raw Apify Output: What the Actor Returns
When the Apify node finishes, it returns one item per post scraped — typically around 19 items for a 20-video profile run. Each item is a rich JSON object containing both account-level information (repeated on every post item) and post-specific data.
Account fields available on every item:
authorMeta.profileUrl— TikTok profile URLauthorMeta.signature— Bio/descriptionauthorMeta.following— How many accounts this user followsauthorMeta.fans— Follower countauthorMeta.heart— Total hearts received across all videosauthorMeta.video— Total number of videos posted
Post fields available per item:
webVideoUrl— Direct URL to the TikTok postshareCount,playCount,commentCount— Engagement metricshashtags— Array of hashtag objects (requires cleanup — see below)text— Post caption/descriptioncreateTime— Unix timestamp of when the post was published
Splitting Account Info from Post Data
Since every item from the Apify node contains both account data and post data, we use a Split Out node to create two parallel branches — one that processes the account information and one that processes the posts.
Connect the Split Out node to the Apify output, then draw two separate connection lines — one to each downstream branch. Both branches receive the same 19 items, but they process different fields from those items.
This dual-branch pattern is a clean way to populate two different sheets from a single API call. You make one Apify request, pay for one run, and get both your account stats and post metrics in one pass.

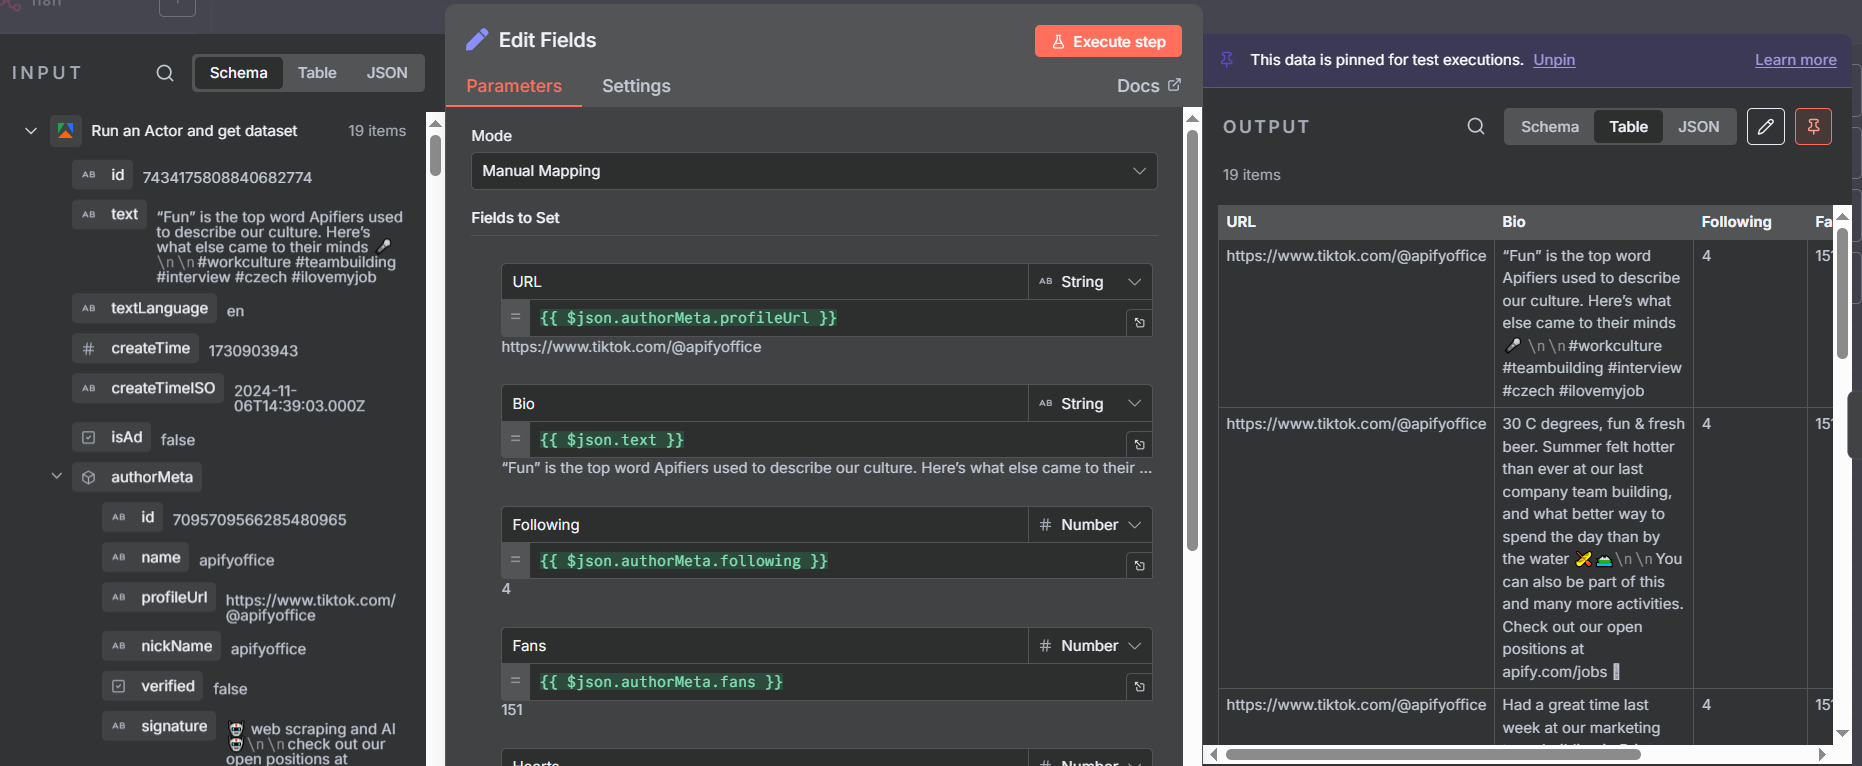
Branch 1: Extracting Account Information
The first branch processes the account-level metadata. Add an Edit Fields node after the split and map only the account fields you need:
- URL:
{{ $json.authorMeta.profileUrl }} - Bio:
{{ $json.authorMeta.signature }} - Following:
{{ $json.authorMeta.following }} - Fans:
{{ $json.authorMeta.fans }} - Hearts:
{{ $json.authorMeta.heart }} - Videos:
{{ $json.authorMeta.video }}
In n8n, you can drag and drop fields from the sample output directly into the Edit Fields node instead of typing the expressions manually — just run the Apify node once with test data pinned, then drag the fields you want into the mapping.
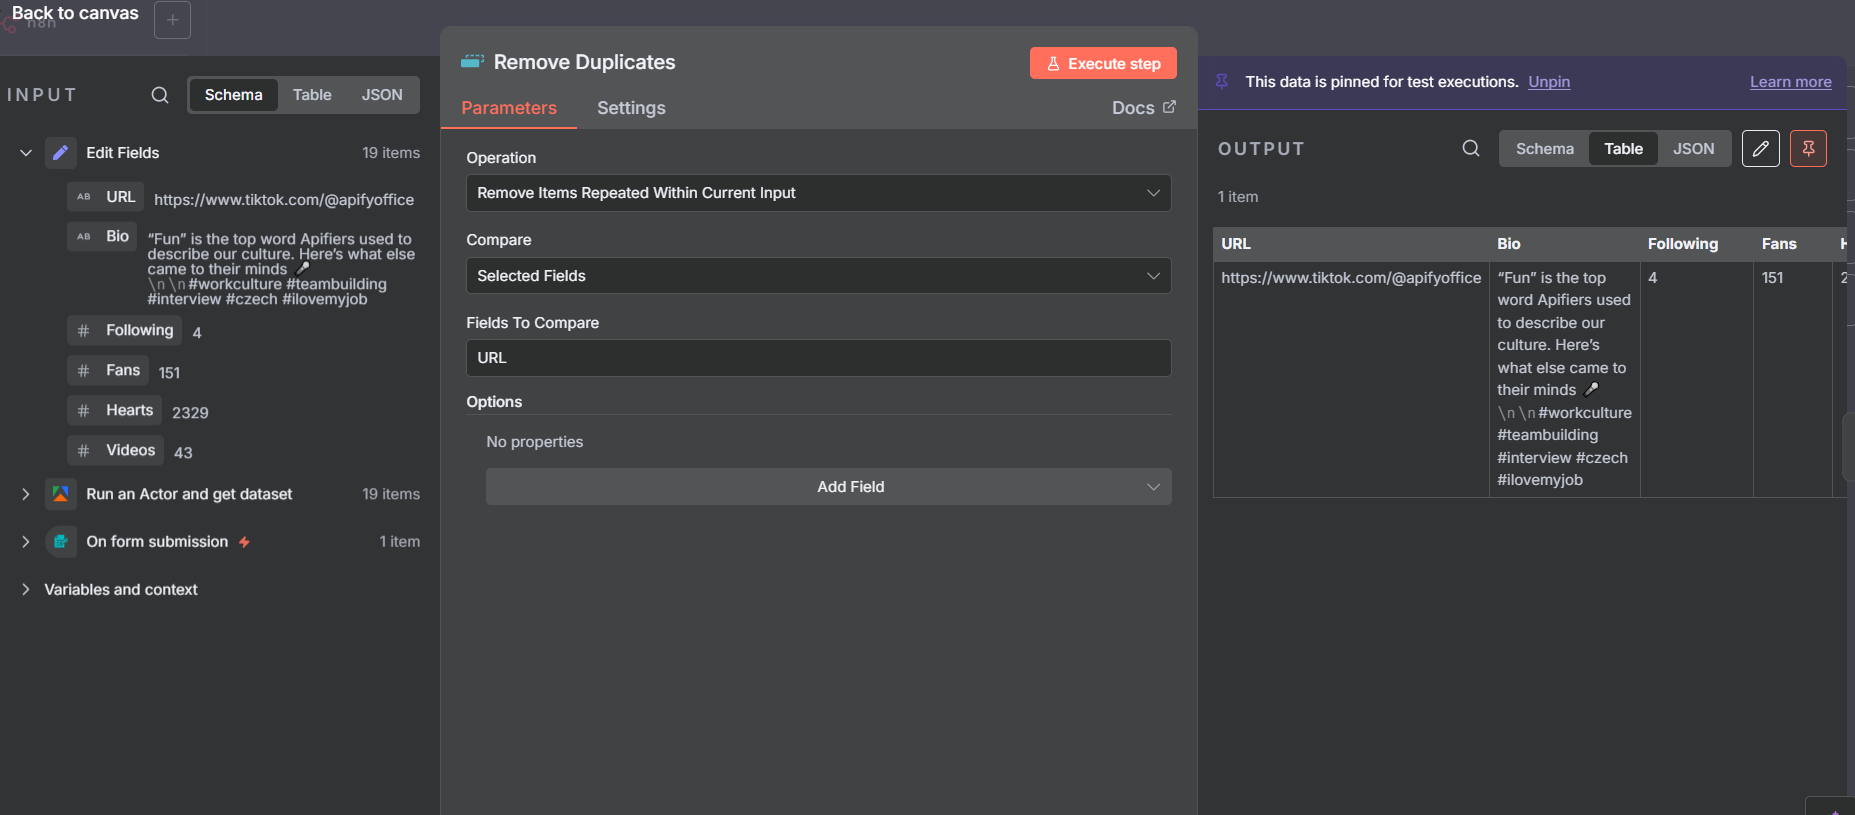
Removing Duplicate Account Rows
Here’s an important detail: since the Apify output gives us 19 items (one per post), and each item contains the same account data, the Edit Fields node after the split produces 19 identical rows of account information. We only want to write one row to the spreadsheet.
Add a Remove Duplicates node between the Edit Fields and the Google Sheets append. Configure it to compare on the URL field — since all 19 items have the same profile URL, they all get collapsed into a single unique item.
After the Remove Duplicates node you’ll see the item count drop from 19 to 1 — that’s your single clean account record ready to write to Google Sheets.
Writing Account Data to Google Sheets
Connect a Google Sheets node set to Append Row to write the account record. Point it at your spreadsheet’s Account Information tab and map the fields to your column headers:
- Column A (URL) →
{{ $json.URL }} - Column B (Bio) →
{{ $json.Bio }} - Column C (Following) →
{{ $json.Following }} - Column D (Fans) →
{{ $json.Fans }} - Column E (Hearts) →
{{ $json.Hearts }} - Column F (Videos) →
{{ $json.Videos }}
Each time the workflow runs for a new username, a fresh row gets appended — giving you a running history of accounts you’ve analyzed. Over time this becomes a useful reference for tracking how accounts grow or change between scrape runs.

Branch 2: Filtering for High-Performing Posts
The second branch handles the post data. Before writing anything to the spreadsheet, we add a Filter node to keep only posts that meet a minimum engagement threshold — filtering out low-quality content and keeping only the posts worth analyzing.
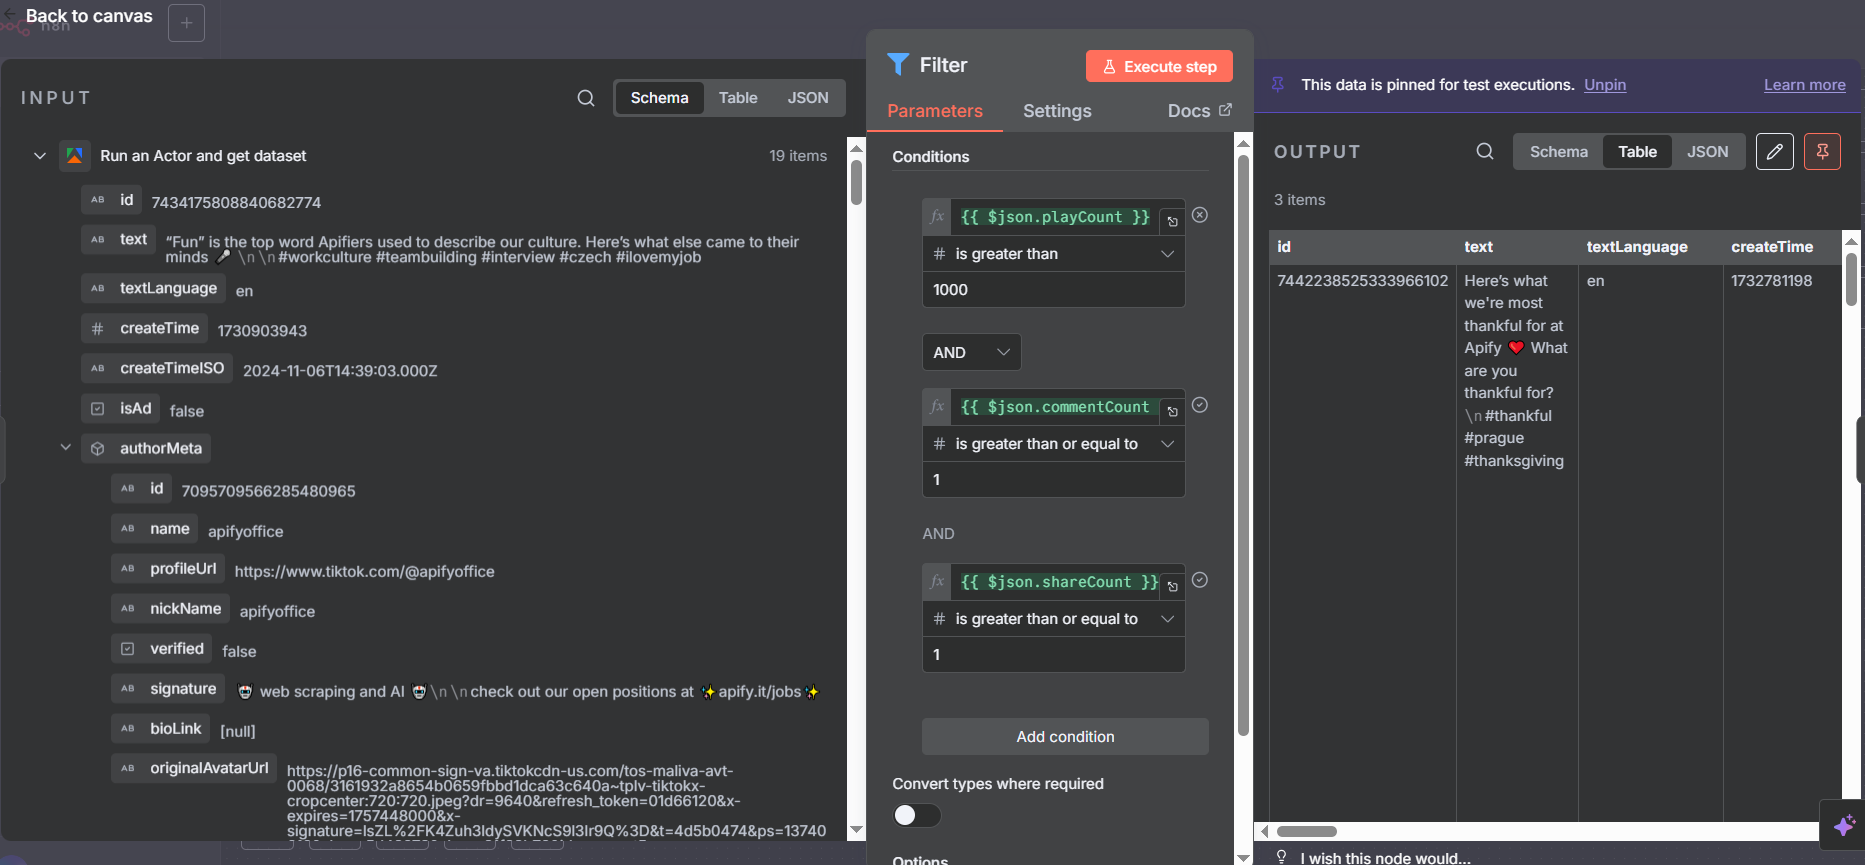
The filter in this workflow uses three conditions joined by AND logic:
- Play count is greater than 1,000
- Comment count is greater than 0
- Share count is greater than 0
This drops posts that have very low views, no comments, or no shares — ensuring the Posts tab in your spreadsheet only contains content that generated real engagement. In the example workflow, this filters the 19 raw posts down to just 3 high-performers.
Adjust the thresholds to match your use case. For a major brand’s account, you might set the play threshold much higher (100,000+). For a smaller niche account, 1,000 plays might already be impressive.

Critical Tip: Set Data Type to Number in the Filter Node
This is the most common mistake people make when first setting up the Filter node in n8n: by default, filter conditions treat values as Strings. When comparing play counts and comment counts, you need to switch the data type to Number.
Click on each filter condition and look for the data type dropdown — it will show “String” by default. Change it to “Number” for any numeric comparison (greater than, less than, equals a number). If you leave it as String, n8n performs lexicographic comparison instead of numeric comparison, which gives completely wrong results (e.g., “1000” might be considered less than “200” because “1” comes before “2” as a character).
After fixing the data types, the AND/OR logic selector lets you decide whether all conditions must be true (AND) or any one of them is sufficient (OR). For this use case, AND ensures every post in the output meets all three criteria.
Edit Fields for Post Data
After the Filter node, add an Edit Fields node to extract just the post fields needed for the spreadsheet. Map these fields:
- ProfileURL:
{{ $json.authorMeta.profileUrl }}— so you know which account the post belongs to - VideoURL:
{{ $json.webVideoUrl }}— direct link to the TikTok post - Shares:
{{ $json.shareCount }} - Plays:
{{ $json.playCount }} - Comments:
{{ $json.commentCount }} - Hashtags: special handling required (see next section)
Again, use n8n’s drag-and-drop field mapping — run the workflow once with test data pinned, then drag the values you need directly from the sample output panel into your Edit Fields node. This is faster and less error-prone than typing expressions manually.
Fixing the Hashtags Array
The hashtags field from the TikTok scraper comes as an array of objects, where each object has a name property. If you write this directly to Google Sheets, you get a messy JSON array in the cell instead of a clean comma-separated list.
To fix this, use a JavaScript expression in the Edit Fields node to map and join the hashtag names:
{{ $json.hashtags.map(h => h.name).join(', ') }}
This maps over the array, pulls just the name field from each object, and joins them with , — producing output like marketing, automation, n8n, nocode.
Important: After entering this expression, change the output type of the Hashtags field from “String (default)” to String explicitly. n8n doesn’t always auto-detect the output type when you use custom expressions, and leaving it as “default” can cause a type mismatch error when writing to Google Sheets. This is a subtle bug that can take a while to track down the first time you encounter it.
Understanding the Filter Results
After the Filter node processes the 19 posts from the Apify actor, you’ll typically see a significant reduction in items. In the example workflow, 19 raw posts filtered down to 3 posts that met the engagement criteria (plays > 1,000, comments > 0, shares > 0).
This is expected and desirable behavior. For most TikTok accounts, the majority of posts don’t generate meaningful engagement — a small number of videos drive most of the profile’s total views and interactions. By filtering to high-performers only, your Google Sheet stays clean and focused on the content that actually matters for your research.
If you find the filter is too aggressive and dropping too many posts, reduce the thresholds. If it’s letting through too many mediocre posts, raise them. You can also add additional conditions — filter by specific hashtags, minimum share count, or posts from a specific date range — using AND/OR logic.
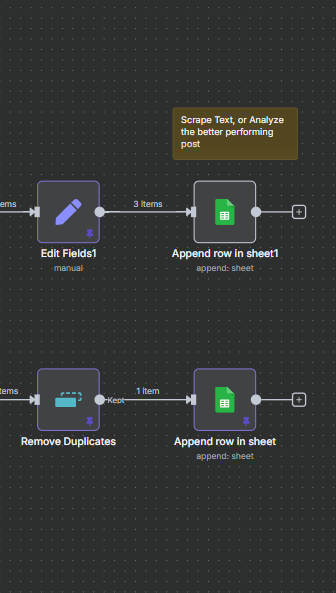
Writing Posts to Google Sheets
The final node in the posts branch is another Google Sheets Append Row node — this time pointing at the Posts tab of your spreadsheet. Map the fields from the Edit Fields node to your column headers:
- Column A: Profile URL
- Column B: Video URL
- Column C: Shares
- Column D: Plays
- Column E: Comments
- Column F: Hashtags (the cleaned comma-separated string)
Use Append Row (not Append or Update). These are always new records — there’s no row to match and update — so plain Append is the right operation here.
Each workflow run appends new rows. Run it daily and you build a longitudinal dataset of any TikTok account’s best-performing content over time — useful for spotting trends in what’s resonating with a particular audience.
Use Cases for TikTok Scraping with n8n
The same workflow pattern works for a wide range of research and monitoring use cases:
Competitor Analysis: Profile your competitors’ TikTok accounts weekly. Track follower growth, total hearts, and which types of posts get the most plays. Spot patterns in their high-performing content to inform your own strategy.
Affiliate Research: If you’re running or evaluating affiliate partnerships, scrape the TikTok presence of brands or creators you’re considering. High engagement signals an active, authentic audience. Low engagement despite high follower counts may indicate bot followers.
Influencer Vetting: Before partnering with a creator, pull their recent posts and check real engagement metrics — plays, shares, and comment counts — rather than relying on vanity follower counts.
Content Intelligence: Track hashtags, themes, and post formats that consistently drive high play counts in your niche. Use the data to reverse-engineer what TikTok’s algorithm currently rewards.
Account Portfolio Monitoring: If you manage multiple TikTok accounts, run the workflow for each username on a schedule and keep a master spreadsheet of all accounts’ stats side by side.
Extending the Workflow
The version built in this tutorial is a solid foundation, but there are several ways to take it further:
Add AI analysis: Pipe the post captions and hashtags into an AI node (Claude or GPT) to categorize content themes, identify patterns in successful posts, or generate insights about the account’s content strategy.
Scrape post text: The text field on each item contains the full post caption. This is valuable for content research — analyzing which topics, hooks, or formats correlate with high play counts.
Schedule for multiple accounts: Add a Google Sheets “Read Rows” node at the start to pull a list of usernames from a spreadsheet, then loop through them. One scheduled workflow run can profile your entire competitor watchlist.
Add Slack or email notifications: When a competitor’s post breaks a certain play threshold, trigger a Slack message to your team. This keeps you informed about viral content in your niche in near-real-time.
Track changes over time: Run the account info branch on a weekly schedule and keep all rows (don’t overwrite). This builds a time-series of follower count, hearts, and video count — letting you chart account growth with a simple spreadsheet chart.
Tips and Common Issues
Change Filter data types from String to Number. This is the most frequent setup mistake. Every numeric comparison in the Filter node (plays, shares, comments) must have its data type explicitly set to Number. String comparison gives wrong results for numbers.
Set the Hashtags field type to String explicitly. After using the .map().join() expression for hashtags, manually set the field’s output type to String in the Edit Fields node. Otherwise you may get a type error when n8n tries to write the value to Google Sheets.
Use Append Row, not Append or Update Row. Every post and every account record is a new entry. “Append or Update” requires a match column — without one, you’ll get errors on every run.
Start with a small maxPostsPerProfile. During testing, set this to 5 or 10. Once you’re confident the workflow is working correctly, increase it. Accidentally running a large scrape while debugging wastes Apify credits.
Pin test data after the first run. After the Apify node runs successfully once, pin the output data. This lets you test and configure all downstream nodes (Edit Fields, Filter, Google Sheets) without spending more credits on additional actor runs.
