The data editor widget allows you to edit dataframes and many other data structures in a table-like UI.
It’s like an Excel-like spreadsheet inside your Streamlit app.
Need a Streamlit developer? Click Here
Syntax
st.data_editor(data, *, width="stretch", height="auto", use_container_width=None, hide_index=None, column_order=None, column_config=None, num_rows="fixed", disabled=False, key=None, on_change=None, args=None, kwargs=None, row_height=None)
| Parameter | Type | Description |
|---|---|---|
| data | Any (DataFrame, Series, List, Dict, etc.) | The data to display and edit in the editor. Supports pandas, NumPy, lists, sets, tuples, dicts, etc. |
| width | "stretch", "content", int | Controls the editor width. "stretch" (default) matches the container width, "content" fits content, or set a fixed width in pixels. |
| height | "auto", int | Controls the editor height. "auto" shows up to 10 rows by default. Use an integer for fixed pixel height with scroll enabled. |
| use_container_width | bool (Deprecated) | Previously used to stretch width, now replaced by width=”stretch”. |
| hide_index | bool or None | Whether to hide the index column(s). Defaults to None, which auto-determines based on data. |
| column_order | Iterable[str] or None | Allows custom ordering of displayed columns. If None, all columns show in their natural order. You can omit or reorder columns using a list. |
| column_config | dict or None | Customizes column labels, formatting, types, widths, visibility, min/max limits, and editability. Can target columns by name or index. |
| num_rows | "fixed" or "dynamic" | Controls row editing. "fixed" (default) disallows adding/deleting rows. "dynamic" enables adding/deleting rows but disables column sorting. |
| disabled | bool or `Iterable[str | int]` |
| key | str | Assigns a unique key to track the widget state. Must be unique if multiple editors exist on the page. |
| on_change | callable | A callback function triggered when the editor’s value changes. |
| args | list or tuple | Optional positional arguments passed to the on_change callback. |
| kwargs | dict | Optional keyword arguments passed to the on_change callback. |
| row_height | int or None | Controls row height in pixels. Defaults to auto-calculated height for single-line text. |
| Returns | DataFrame, Series, PyArrow Table, NumPy Array, List, Set, Tuple, Dict | Returns the edited data in the same type as provided. If type is unsupported, returns a pandas DataFrame. |
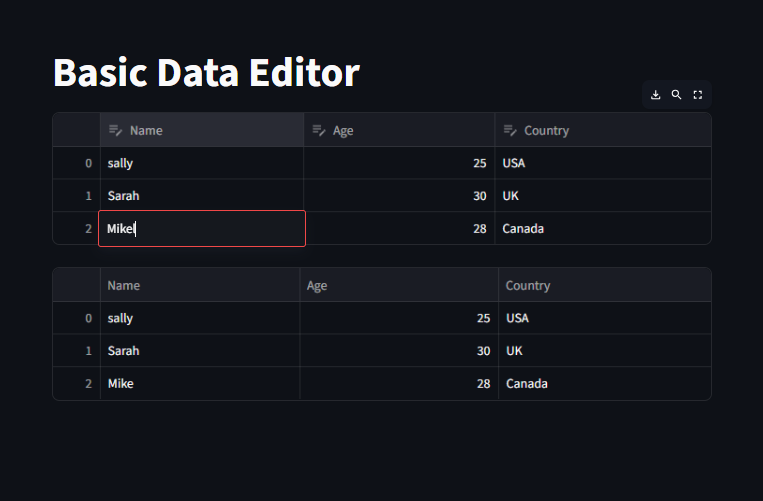
Example
Here, we can edit cells directly. Changes are reflected in editor
					import streamlit as st
import pandas as pd


df = pd.DataFrame({
    "Name": ["John", "Sarah", "Mike"],
    "Age": [25, 30, 28],
    "Country": ["USA", "UK", "Canada"]
})


st.title("Basic Data Editor")

editor = st.data_editor(df)
st.write(editor)
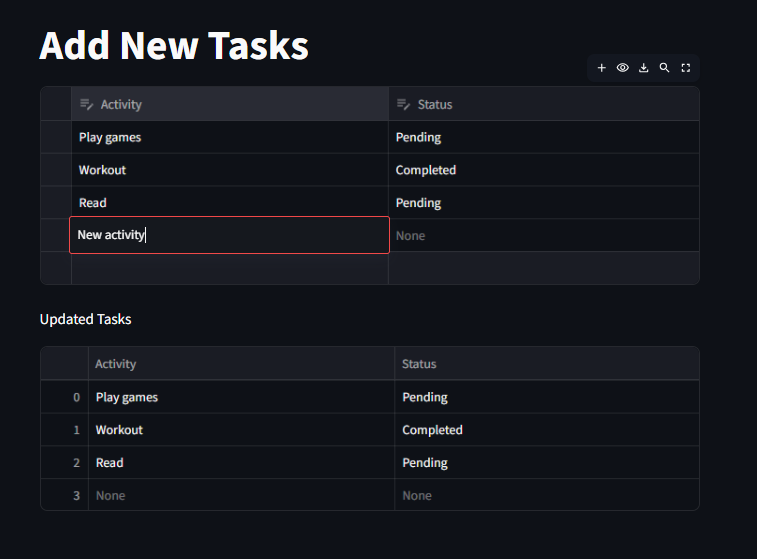
Adding New Rows
Enabling Row Insertion
By adding num_rows=”dynamic”, we can add unlimited rows
The default values for new rows are NaN
					import streamlit as st
import pandas as pd

df = pd.DataFrame({
    "Activity": ["Play games", "Workout", "Read"],
    "Status": ["Pending", "Completed", "Pending"]
})

st.title("Add New Tasks")

edited_df = st.data_editor(df, num_rows="dynamic")
st.write("Updated Tasks")
st.write(edited_df)
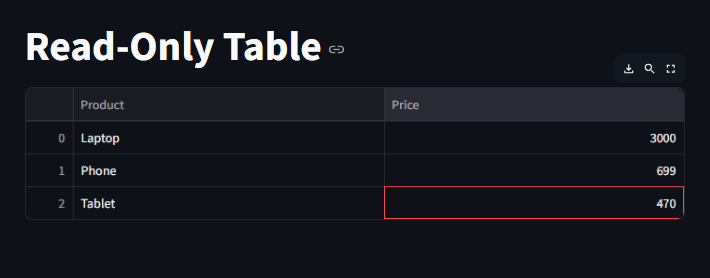
Read Only Table
Here we can disable editing by setting disabled=True
					import streamlit as st
import pandas as pd


df = pd.DataFrame({
    "Product": ["Laptop", "Phone", "Tablet"],
    "Price": [3000, 699, 470]
})


st.title("Read-Only Table")

st.data_editor(df, disabled=True)
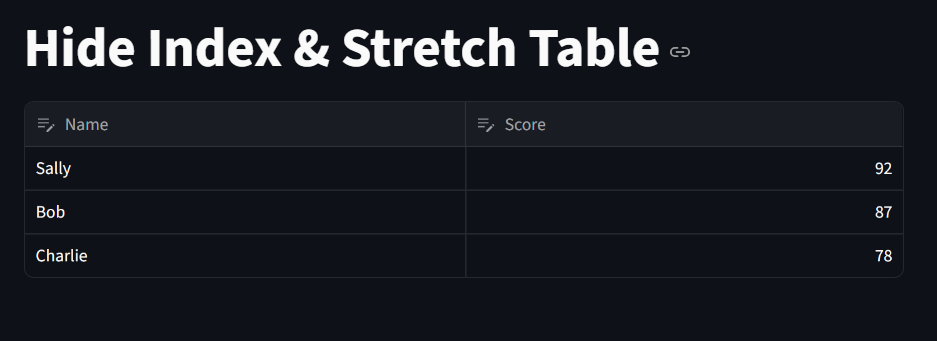
Hiding Index and Resizing Table
Here we remove the index column and expand the table to full width
					import streamlit as st
import pandas as pd

df = pd.DataFrame({
    "Name": ["Sally", "Bob", "Charlie"],
    "Score": [92, 87, 78]
})

st.title("Hide Index & Stretch Table")

st.data_editor(df, hide_index=True, use_container_width=True)
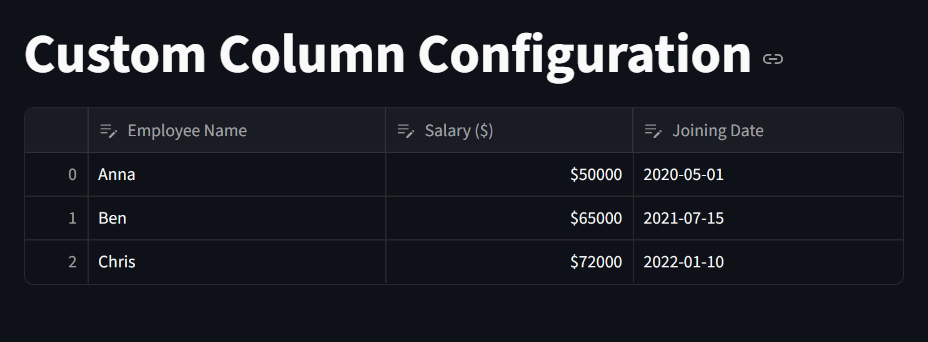
Customizing Column Labels and Formatting
we can customize column using the column_config
Here, we rename the columns, we format salary as currency and display date picker for date columns.
import streamlit as st
import pandas as pd

df = pd.DataFrame({
    "name": ["Anna", "Ben", "Chris"],
    "salary": [50000, 65000, 72000],
    "join_date": pd.to_datetime(["2020-05-01", "2021-07-15", "2022-01-10"])
})

st.title("Custom Column Configuration")

st.data_editor(
    df,
    column_config={
        "name": "Employee Name",
        "salary": st.column_config.NumberColumn("Salary ($)", format="$%d"),
        "join_date": st.column_config.DateColumn("Joining Date")
    }
)
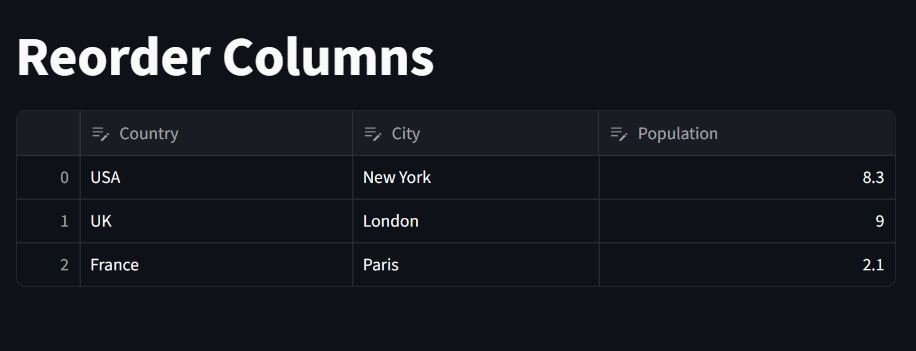
Reordering Columns
we can change the column order
					import streamlit as st
import pandas as pd

df = pd.DataFrame({
    "City": ["New York", "London", "Paris"],
    "Country": ["USA", "UK", "France"],
    "Population": [8.3, 9.0, 2.1]
})

st.title("Reorder Columns")

st.data_editor(df, column_order=["Country", "City", "Population"])
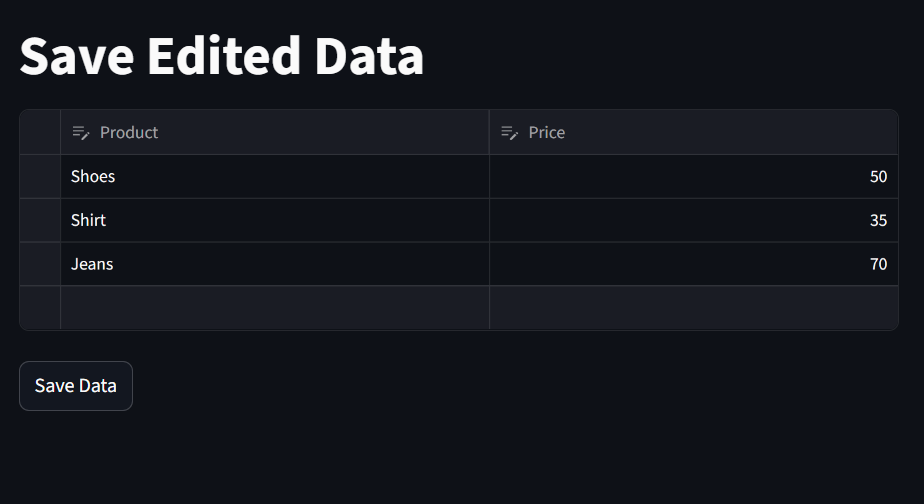
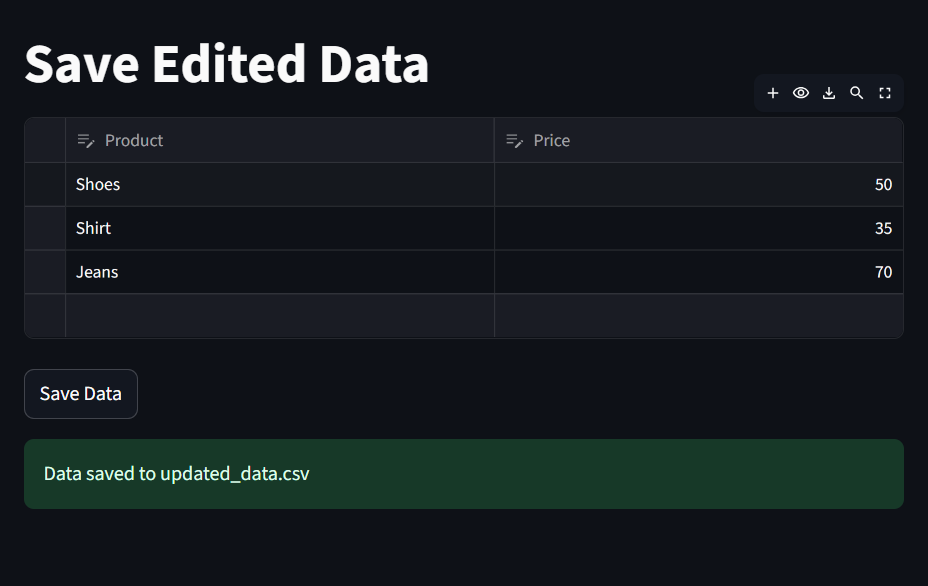
Saving Edited Data
we can export edits to a csv file
					import streamlit as st
import pandas as pd

df = pd.DataFrame({
    "Product": ["Shoes", "Shirt", "Jeans"],
    "Price": [50, 35, 70]
})

st.title("Save Edited Data")

edited_df = st.data_editor(df, num_rows="dynamic")

if st.button("Save Data"):
    edited_df.to_csv("updated_data.csv", index=False)
    st.success("Data saved to updated_data.csv")
Summary
st.data_editoris interactive and powerful.Supports editing, adding, deleting, and formatting data.
Perfect for dashboards, forms, and reporting apps.
Learn more about Streamlit: Click Here
Watch Videos on Streamlit:
