This is the Swiss Army Knife of Streamlit commands.
It does different things depending on what you throw at it.
The st.write() function in Streamlit is a universal display function.
It automatically detects the type of data we pass to it and renders it in the best possible format
Need a Streamlit developer? Click Here
Basic Syntax
*args basically means it accepts any number of arguments
st.write(*args)
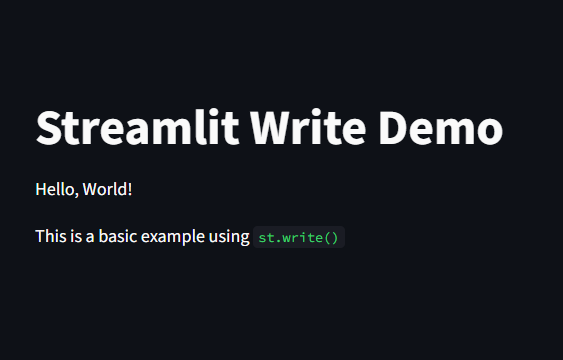
st.write detects plain strings and renders them as normal text.
					import streamlit as st

st.title("Streamlit Write Demo")

st.write("Hello, World!")
st.write("This is a basic example using `st.write()`")
Displaying Numbers and Variables
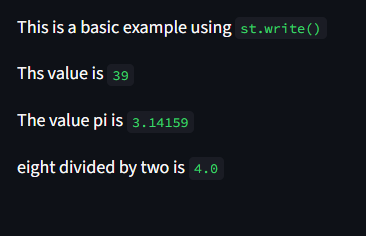
we can easily combine variables and text easily
					value = 39
pi = 3.14159
divide = 8/2

st.write("Ths value is", value)
st.write("The value pi is", pi)
st.write("eight divided by two is", divide)
Displaying DataFrames and Tables
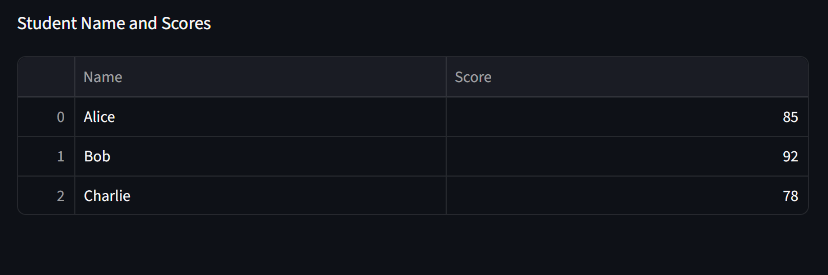
Streamlit automatically detects DataFrames and displays them as interactive tables
					import pandas as pd
import streamlit as st

df = pd.DataFrame({
    "Name": ["Alice", "Bob", "Charlie"],
    "Score": [85, 92, 78]
})

st.write("Student Name and Scores")
st.write(df)
Displaying Markdown
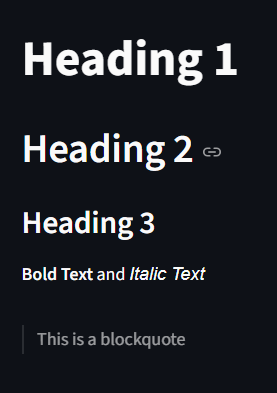
Markdown is a lightweight markup language that allows you to format plain text documents using simple, intuitive characters, making text easy to read and write for both humans
and computers
					st.write("# Heading 1")
st.write("## Heading 2")
st.write("### Heading 3")
st.write("**Bold Text** and *Italic Text*")
st.write("> This is a blockquote")
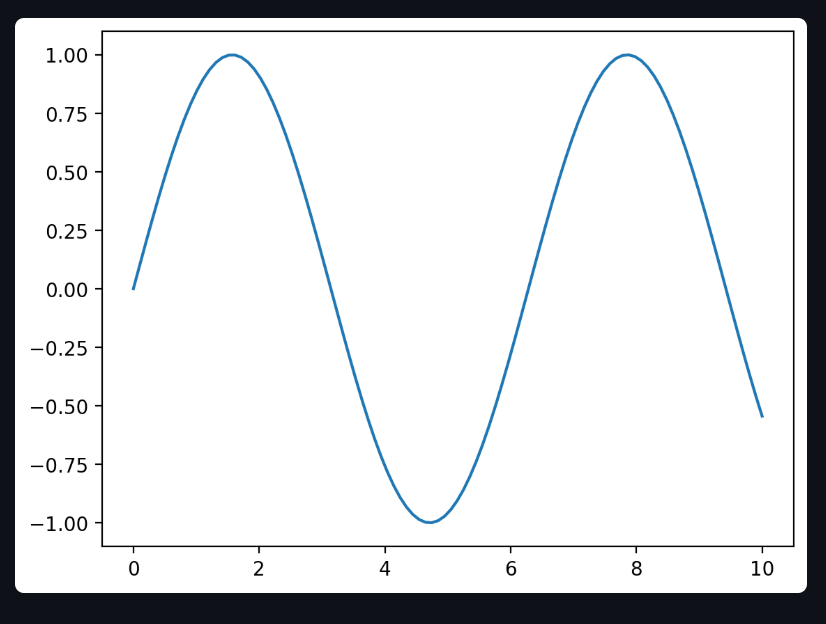
Displaying Charts
we can display charts using st.write..like i said earlier st.write is the swiss knife of streamlit
					import matplotlib.pyplot as plt
import numpy as np

x = np.linspace(0, 10, 100)
y = np.sin(x)

fig, ax = plt.subplots()
ax.plot(x, y)
st.write(fig)
Displaying Images
					from PIL import Image

img = Image.open("sample.png")
st.write("Streamlit Image display with `st.write()`")
st.write(img)

Using Multiple Arguments
we can add multiple values at once in st.write()
st.write("The value of x is", 10, "and y is", 20, "and finally z is", 30)
Use st.write() for quick and flexible output
Use specific Streamlit functions (st.markdown, st.table, st.pyplot) when you need more control
Keep your outputs clean and organized
Combine multiple arguments instead of concatenating strings
Use st.write() with charts, DataFrames, and variables — it’s very powerful
Learn more about Streamlit: Click Here
Watch videos on Stramlit:
