Python Probability Point Function
					import numpy as np
from scipy.stats import norm
import matplotlib.pyplot as plt
np.random.seed(17)
					mean = 0
std_dev = 1
size = 1000
data = np.random.normal(loc=mean, scale=std_dev, size=size)
Example 1
lowest 20%
ppf_20 = norm.ppf(0.2, loc=data.mean(), scale=data.std())
print(ppf_20)
lowest 70%
ppf_70 = norm.ppf(0.7, loc=data.mean(), scale=data.std())
print(ppf_70)
Example 2 Find the data points that are between 25 and 50%
					ppf_25 = norm.ppf(0.25, loc=data.mean(), scale=data.std())
ppf_50 = norm.ppf(0.50, loc=data.mean(), scale=data.std())
print(ppf_25)
print(ppf_50)
Example 3 Find the top 20% data points
ppf_top_20 = norm.ppf((1-0.2), loc=data.mean(), scale=data.std())
ppf_top_20
Example 4 Numpy Percentiles
Cover Quartile, Decile, Percentile in the next video
ppf_75 = np.percentile(data, 75)
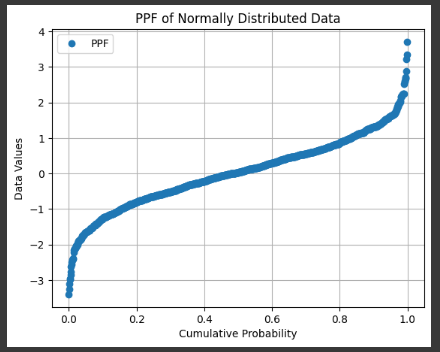
Example 5 Graph Matplotlib
seaborn doesnt have a PPF Option
sorted_data = np.sort(data)
cumulative_probabilities = np.linspace(0, 1, len(sorted_data), endpoint=False)
					plt.plot(cumulative_probabilities, sorted_data, marker='o', linestyle='none', label='PPF')
plt.title('PPF of Normally Distributed Data')
plt.xlabel('Cumulative Probability')
plt.ylabel('Data Values')
plt.legend()
plt.grid(True)
plt.show()

Ryan is a Data Scientist at a fintech company, where he focuses on fraud prevention in underwriting and risk. Before that, he worked as a Data Analyst at a tax software company. He holds a degree in Electrical Engineering from UCF.
