					import numpy as np
import matplotlib.pyplot as plt
from scipy.stats import binom, poisson, geom, randint
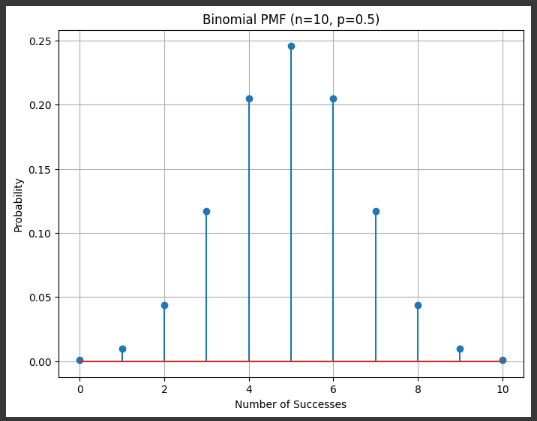
Example 1 Binom
success or failure, multiple trials each time
					n = 10  # number of trials
p = 0.5  # probability of success
k = np.arange(0, n+1)
pmf = binom.pmf(k, n, p)
					plt.figure(figsize=(8, 6))
plt.stem(k, pmf)
plt.title(f'Binomial PMF (n={n}, p={p})')
plt.xlabel('Number of Successes')
plt.ylabel('Probability')
plt.grid(True)
plt.show()
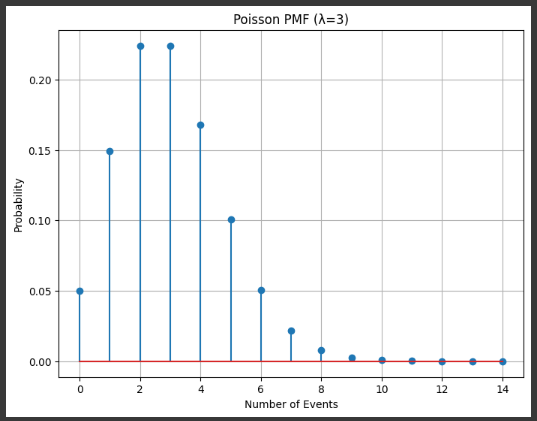
Example 2 Poisson
number of events happening in a fixed interval of time
lambda_poisson = 3 # average rate
k = np.arange(0, 15)
pmf = poisson.pmf(k, lambda_poisson)
					plt.figure(figsize=(8, 6))
plt.stem(k, pmf)
plt.title(f'Poisson PMF (λ={lambda_poisson})')
plt.xlabel('Number of Events')
plt.ylabel('Probability')
plt.grid(True)
plt.show()
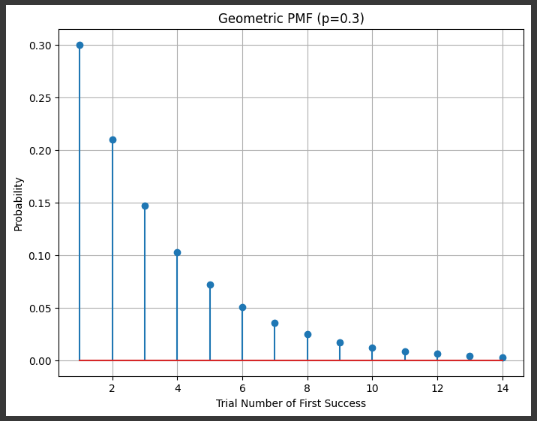
Example 3 Geometric
trials till first success
p_geom = 0.3 # probability of success
k = np.arange(1, 15)
pmf = geom.pmf(k, p_geom)
					plt.figure(figsize=(8, 6))
plt.stem(k, pmf)
plt.title(f'Geometric PMF (p={p_geom})')
plt.xlabel('Trial Number of First Success')
plt.ylabel('Probability')
plt.grid(True)
plt.show()
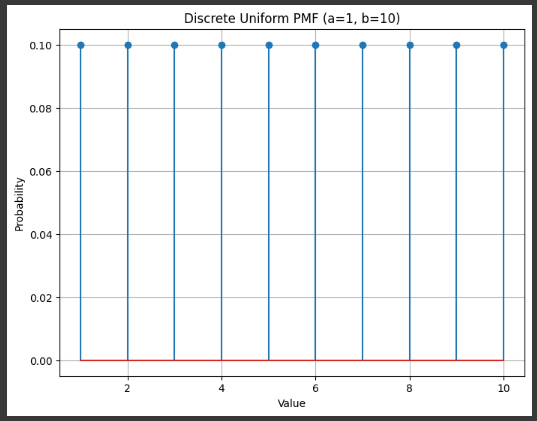
Example 4 Uniform
equal likelyhood of result
					# Parameters
a_uniform = 1  # lower bound
b_uniform = 10  # upper bound
					# Range of possible values
k = np.arange(a_uniform, b_uniform + 1)
					# PMF values
pmf = randint.pmf(k, a_uniform, b_uniform + 1)
					# Plotting
plt.figure(figsize=(8, 6))
plt.stem(k, pmf)
plt.title(f'Discrete Uniform PMF (a={a_uniform}, b={b_uniform})')
plt.xlabel('Value')
plt.ylabel('Probability')
plt.grid(True)
plt.show()