python covariance matrix
					import numpy as np
import pandas as pd
import matplotlib.pyplot as plt
import seaborn as sns
Example 1 Manual
					stock_a = [100, 102, 104, 103, 105]
stock_b = [200, 198, 202, 204, 206]
n = len(stock_a)
					# Step 1: Calculate the means of stock_a and stock_b
mean_a = sum(stock_a) / n
mean_b = sum(stock_b) / n
					# Step 2: Calculate the differences from the means and their products
diff_product_sum = 0
					for i in range(n):
        diff_a = stock_a[i] - mean_a
        diff_b = stock_b[i] - mean_b
        diff_product_sum += diff_a * diff_b
					# Step 3: Calculate the covariance
covariance = diff_product_sum / n
print(covariance)
#The positive value of 3.6 indicates that the prices of Stock A and Stock B tend to move in the same
#direction. When the price of Stock A increases, the price of Stock B also tends to increase,
#and vice versa.
Example 2 Numpy Sample Covariance
					X = [2.1, 2.5, 3.6, 4.0]
Y = [8, 10, 12, 14]
					cov_matrix = np.cov(X, Y)
print("Covariance matrix:\n", cov_matrix)

					cov_xy = cov_matrix[0, 1]
print("Covariance between X and Y:", cov_xy)
Example 4 Pandas Sample - No Option
					data = {'X': [2.1, 2.5, 3.6, 4.0],
        'Y': [8, 10, 12, 14]}
df = pd.DataFrame(data)
cov_df = df.cov()
print("Covariance DataFrame:\n", cov_df)

cov_xy = cov_df.loc['X', 'Y']
print("Covariance between X and Y:", cov_xy)
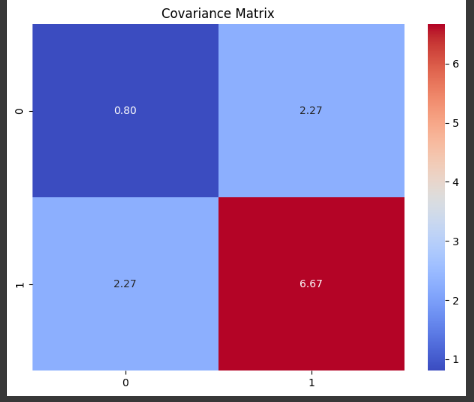
Example 5 Plot Covariance Matrix
					# Plot the covariance matrix as a heatmap
plt.figure(figsize=(8, 6))
sns.heatmap(cov_matrix, annot=True, cmap='coolwarm', fmt='.2f')
plt.title('Covariance Matrix')
plt.show()

					plt.scatter(X, Y)
plt.xlabel('X')
plt.ylabel('Y')
plt.title('Scatter plot of X vs Y')
plt.show()

Ryan is a Data Scientist at a fintech company, where he focuses on fraud prevention in underwriting and risk. Before that, he worked as a Data Analyst at a tax software company. He holds a degree in Electrical Engineering from UCF.
