					import pandas as pd
import numpy as np
import matplotlib.pyplot as plt
from statsmodels.tsa.api import SimpleExpSmoothing
df = pd.read_csv('/content/all_stocks_5yr.csv')
apple_df = df[df["Name"] == "AAPL"].copy()
					apple_df["date"] = pd.to_datetime(apple_df["date"])
apple_df.sort_values("date", inplace=True)
apple_df.set_index("date", inplace=True)
apple_df = apple_df.asfreq('B')
apple_df["close"] = apple_df["close"].interpolate()
apple_close = apple_df["close"]
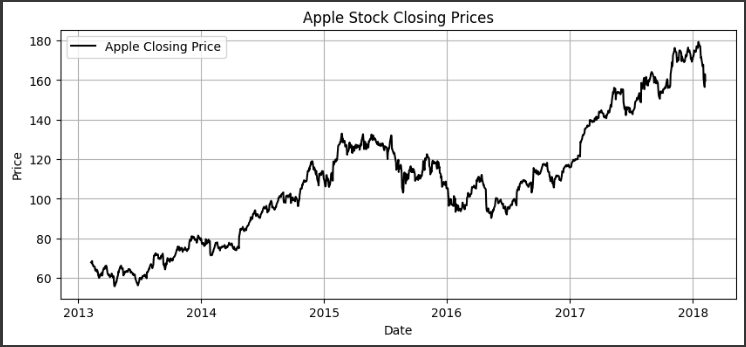
					plt.figure(figsize=(10, 4))
plt.plot(apple_close, label="Apple Closing Price", color="black")
plt.title("Apple Stock Closing Prices")
plt.xlabel("Date")
plt.ylabel("Price")
plt.legend()
plt.grid(True)
plt.show()
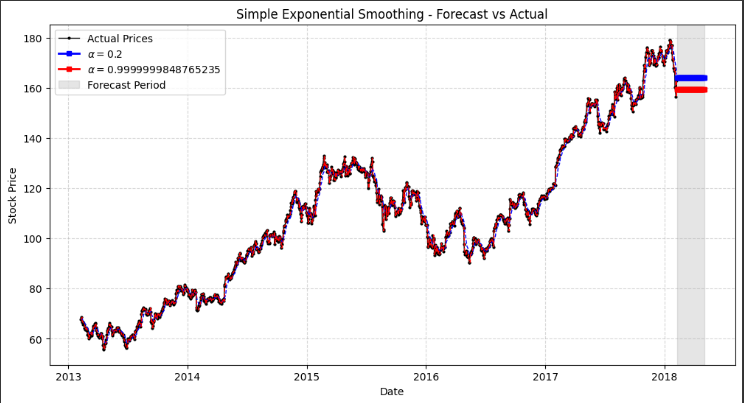
					fit1 = SimpleExpSmoothing(apple_close).fit(
    smoothing_level=0.2, optimized=False
)
fcast1 = fit1.forecast(60).rename(r"$\alpha=0.2$")
					fit2 = SimpleExpSmoothing(apple_close).fit()
fcast2 = fit2.forecast(60).rename(r"$\alpha=%s$" % fit2.model.params["smoothing_level"])
					# Plot actual data
plt.figure(figsize=(12, 6))
plt.plot(apple_close, marker="o", color="black", markersize=2, linestyle="-", linewidth=1, label="Actual Prices")

# Plot fitted values
plt.plot(fit1.fittedvalues, linestyle="--", color="blue", linewidth=1)
plt.plot(fit2.fittedvalues, linestyle="--", color="red", linewidth=1)
#plt.plot(fit3.fittedvalues, linestyle="--", color="green", linewidth=1)

# Forecast lines (thicker & different markers)
(line1,) = plt.plot(fcast1, marker="s", color="blue", markersize=4, linestyle="-", linewidth=2, label=fcast1.name)
(line2,) = plt.plot(fcast2, marker="s", color="red", markersize=4, linestyle="-", linewidth=2, label=fcast2.name)

# Highlight forecast area
plt.axvspan(fcast1.index[0], fcast1.index[-1], color="gray", alpha=0.2, label="Forecast Period")

# Add legend
plt.legend(loc="upper left")
plt.title("Simple Exponential Smoothing - Forecast vs Actual")
plt.xlabel("Date")
plt.ylabel("Stock Price")
plt.grid(True, linestyle="--", alpha=0.5)  # Light grid for better readability
plt.show()